Hamilton Lane Incorporated's management explains the business in its own materials. The slides below do the most of that work, pulled from the documents preserved in Sources. Each source link opens the complete presentation at that slide in a new tab.
Hamilton Lane's newest and fullest quarterly deck: what the firm manages, how the three product lines earn fees, and how those fees convert to earnings. · Open the full document →
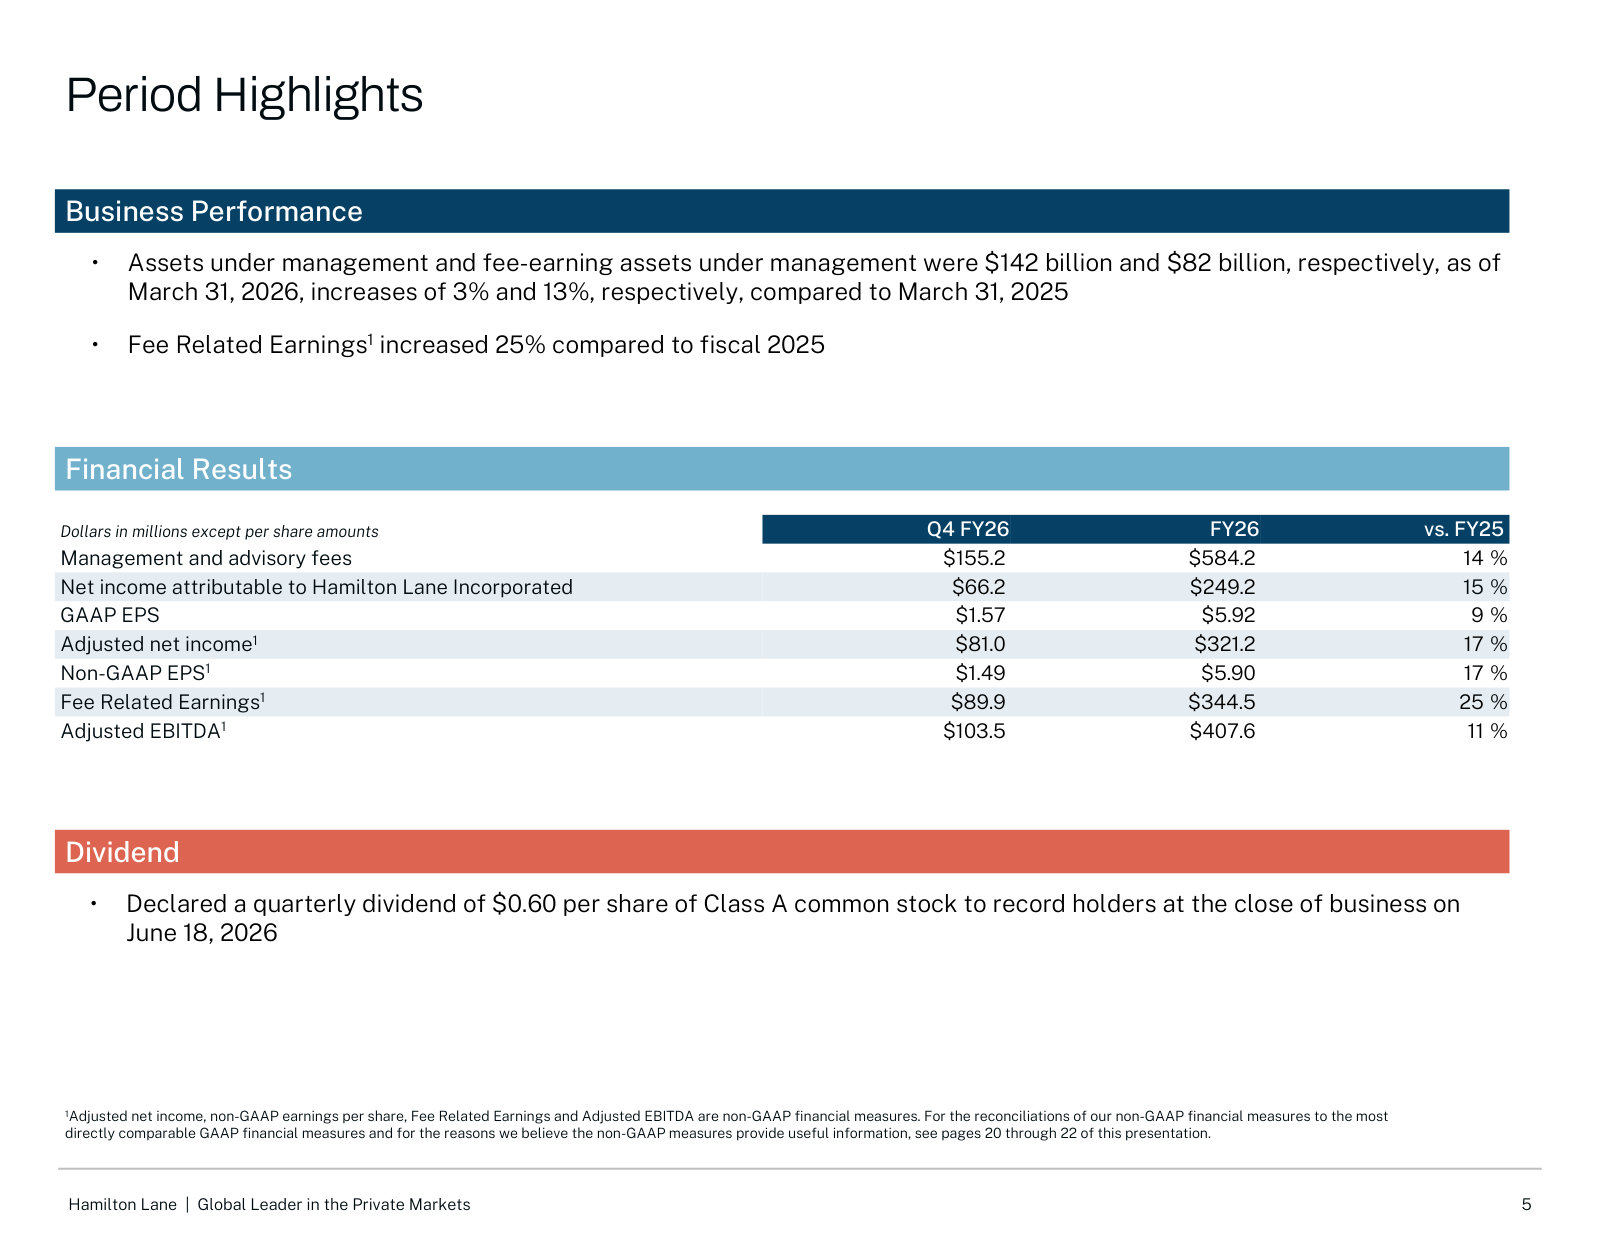
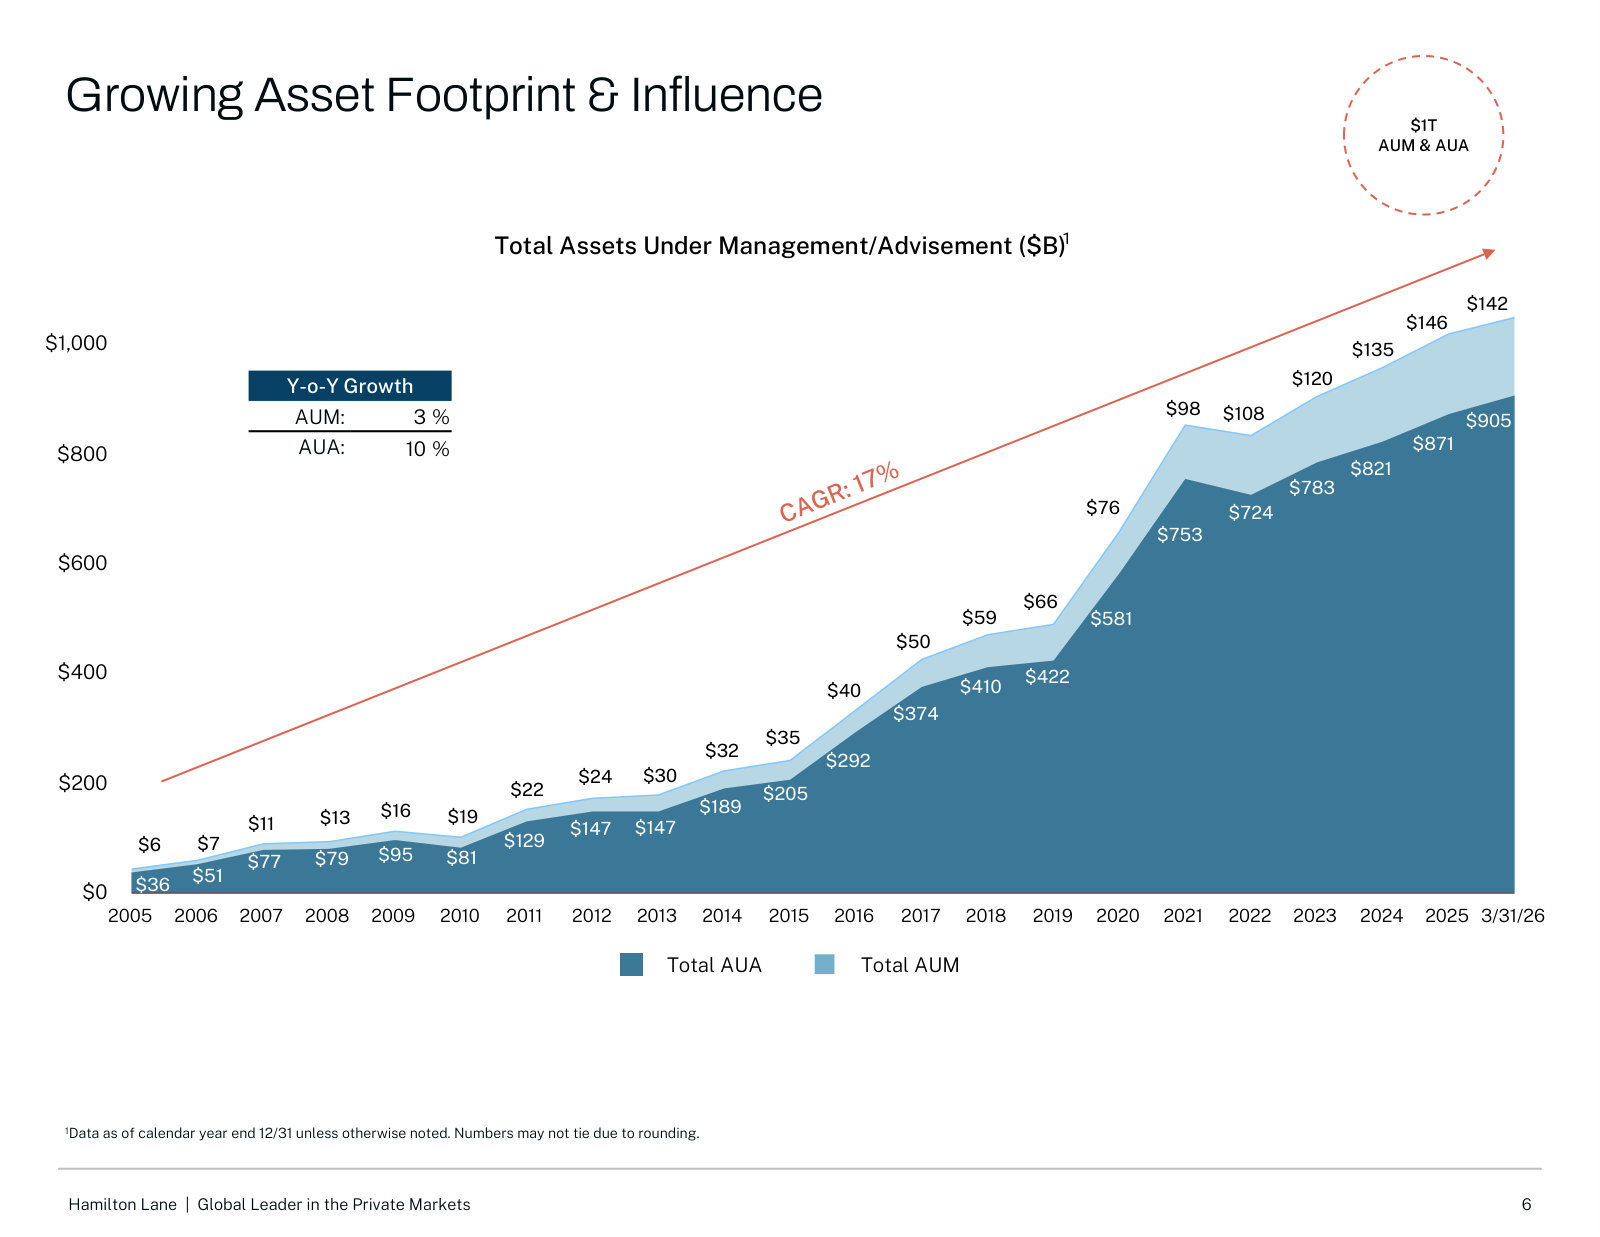
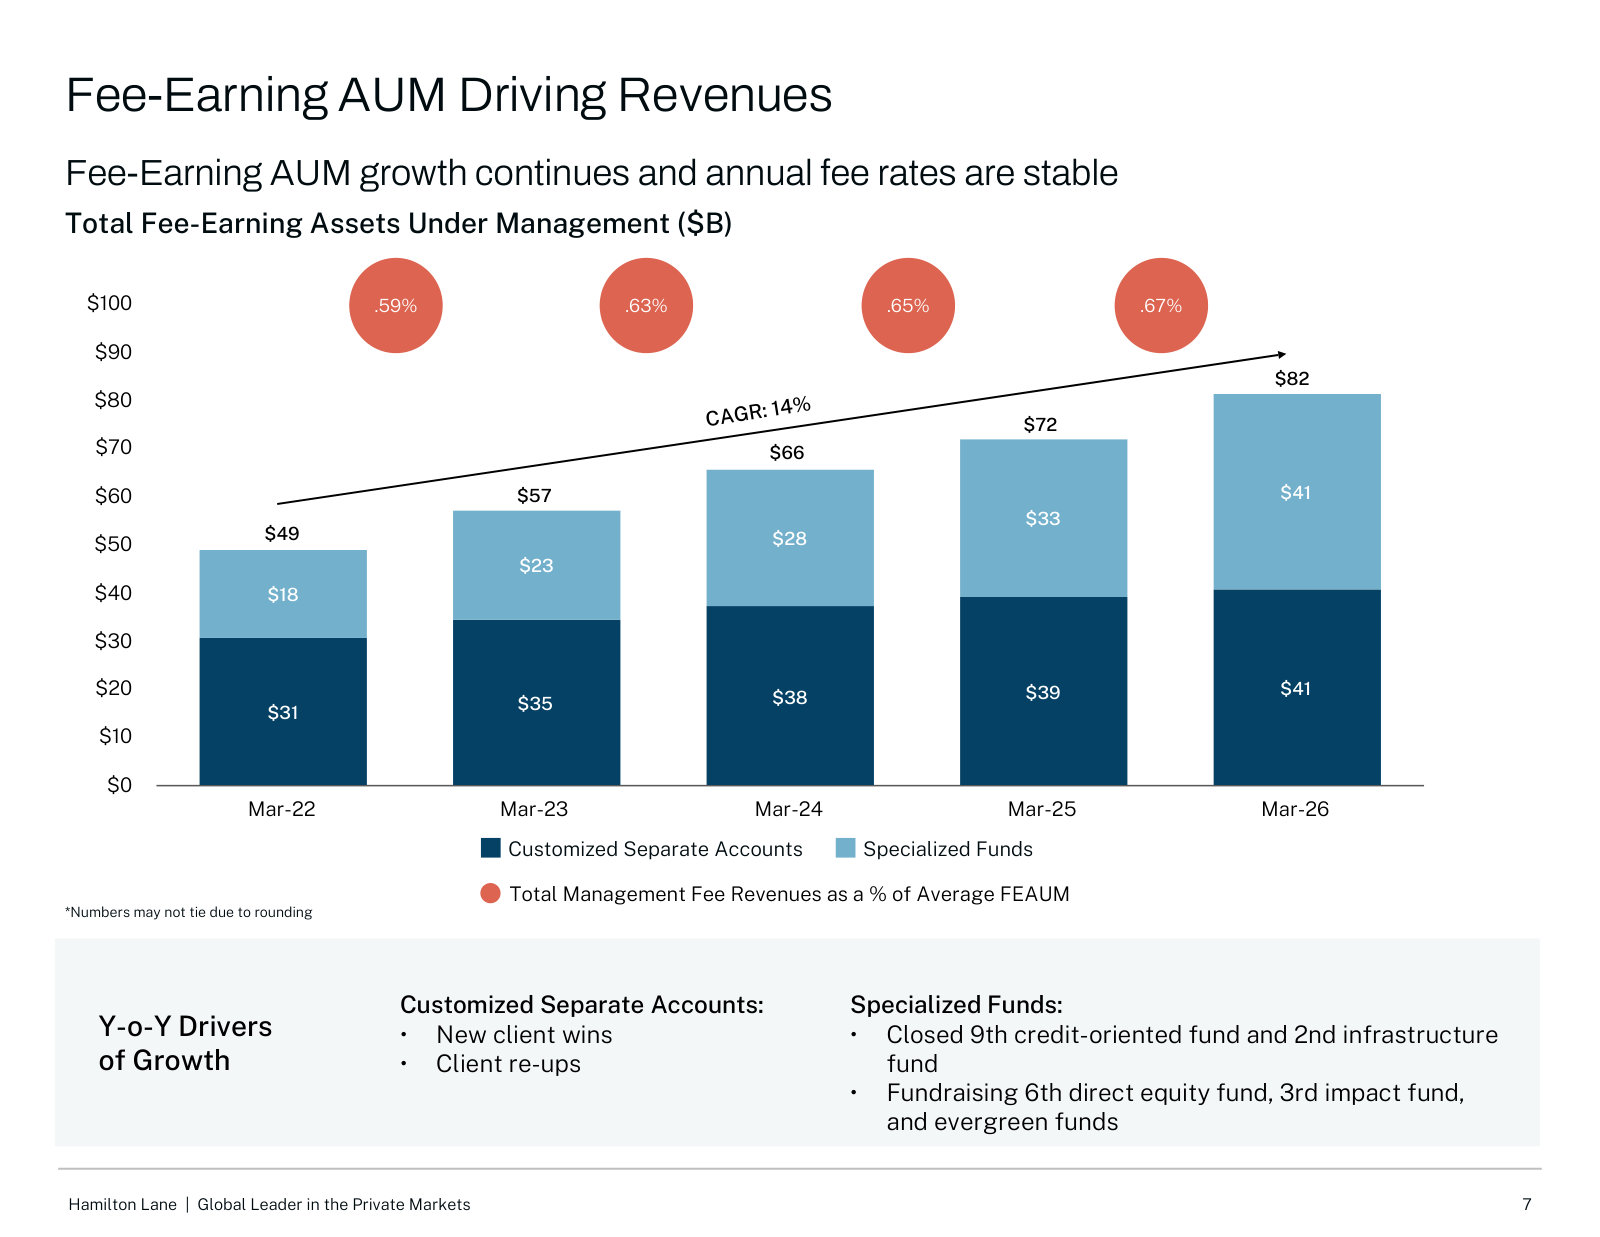
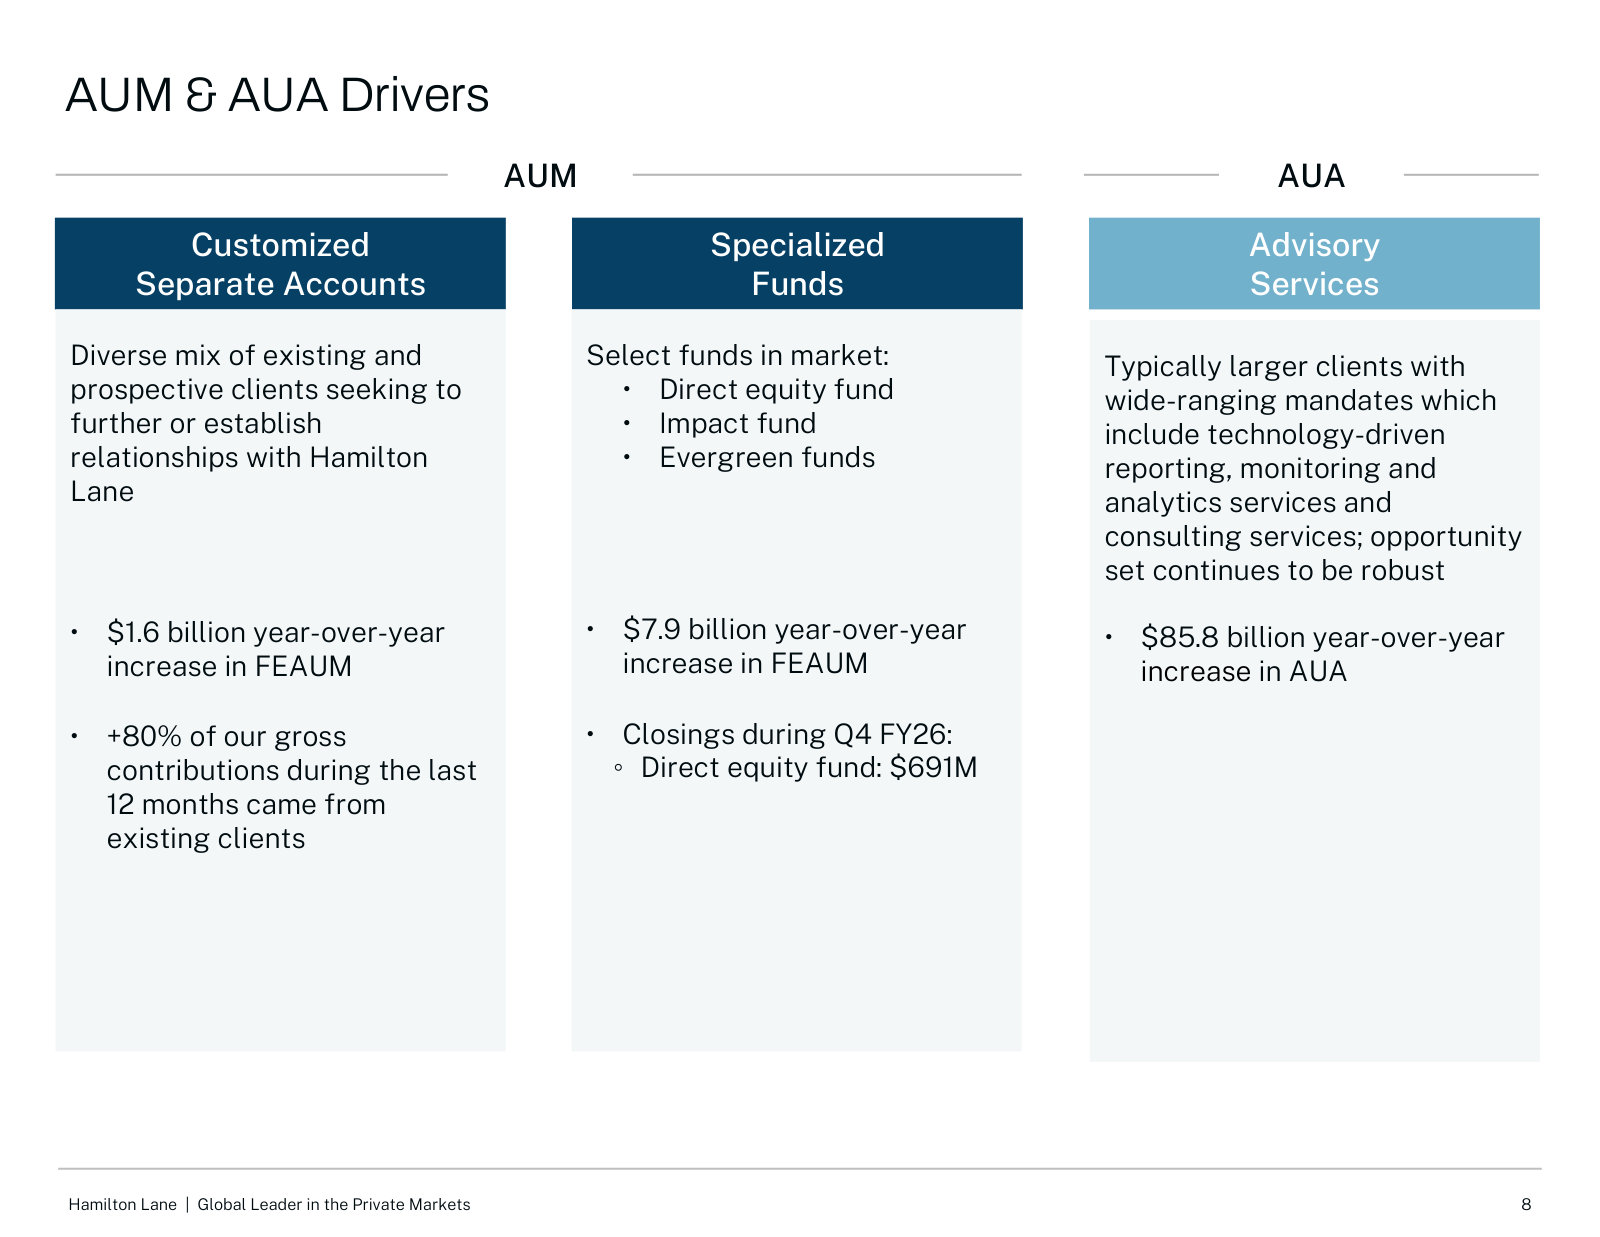
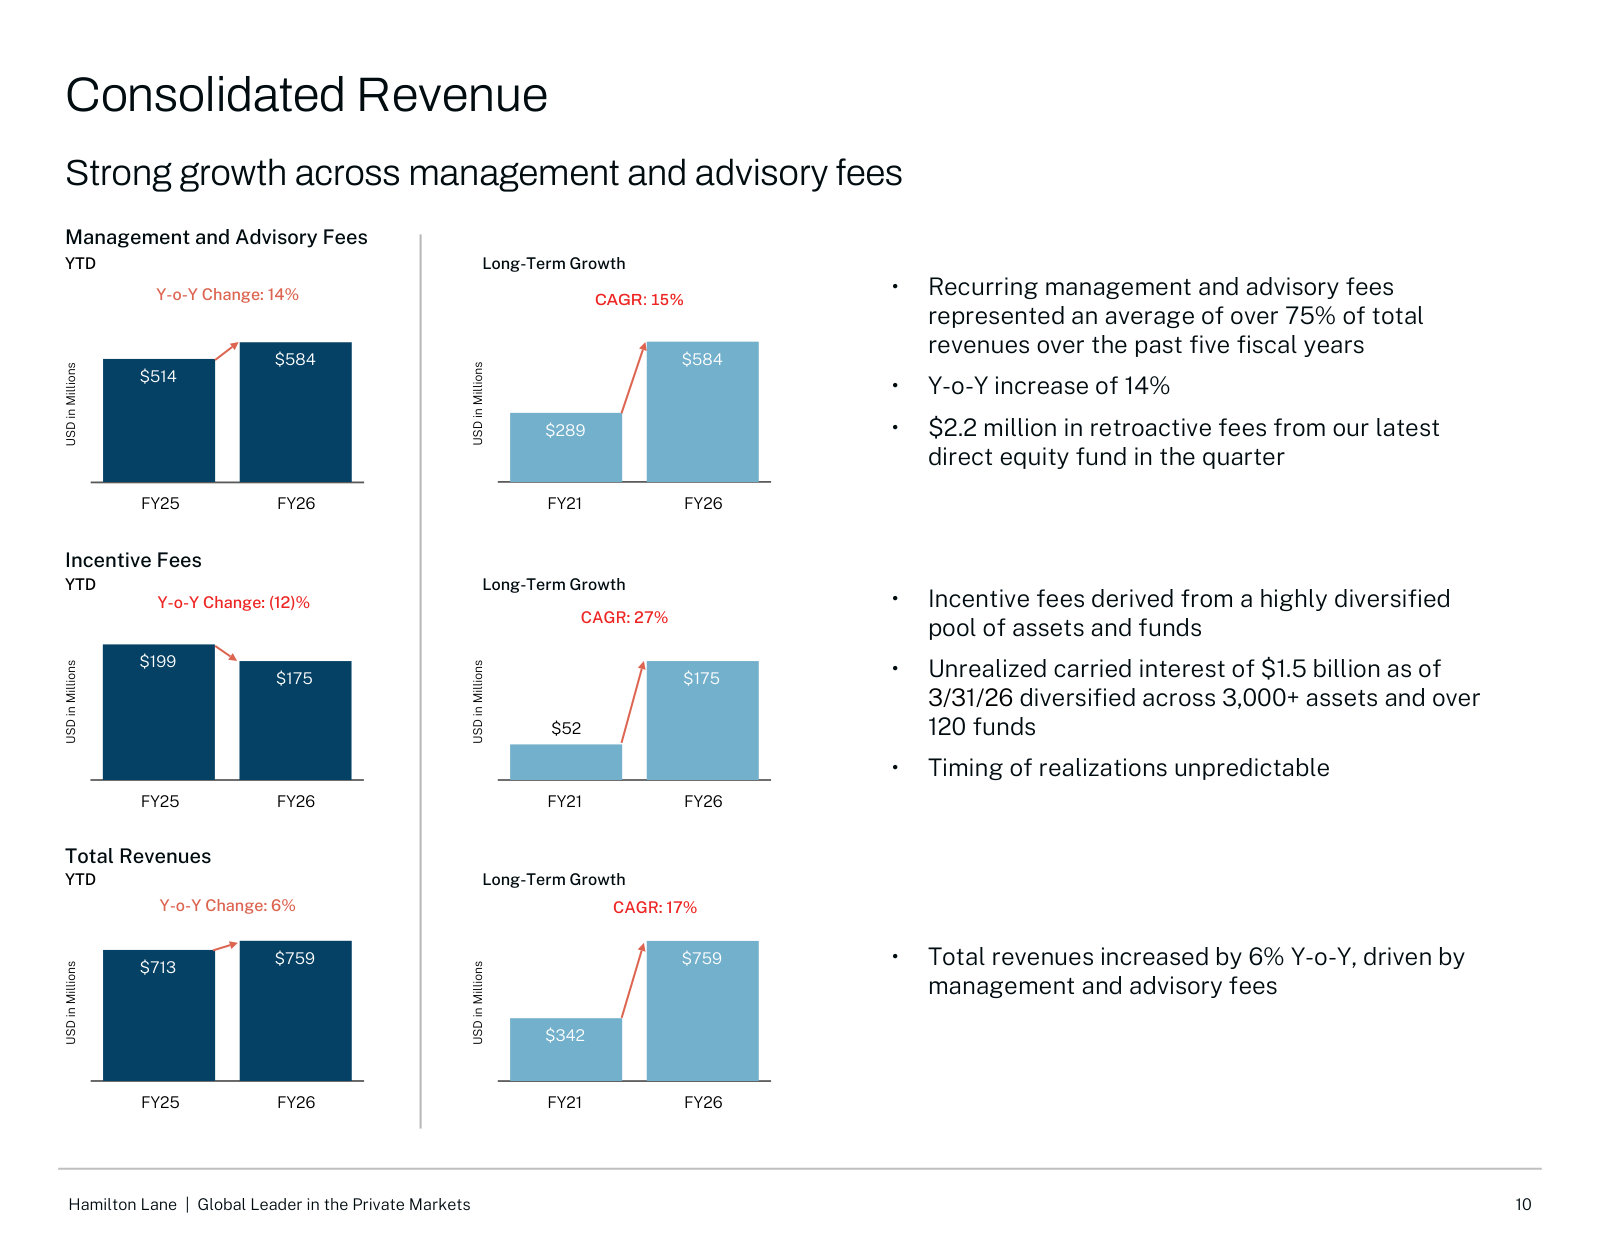
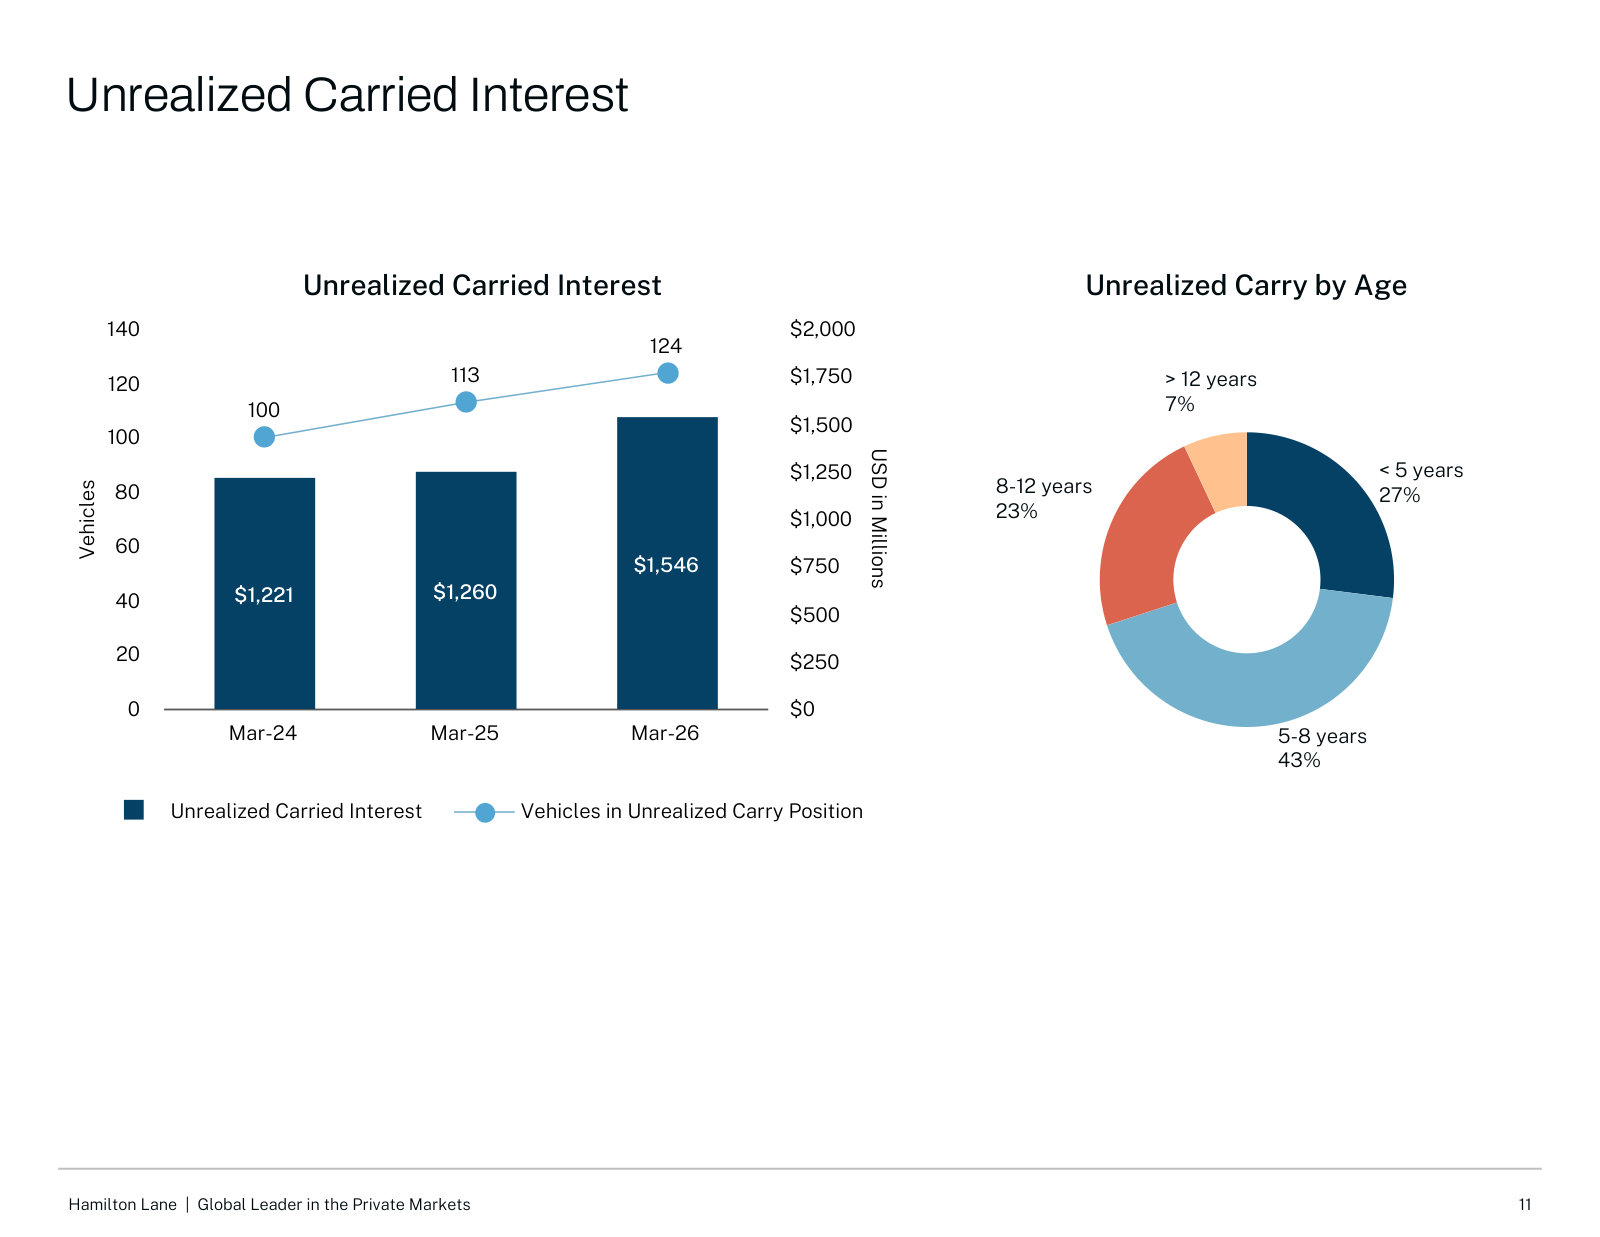
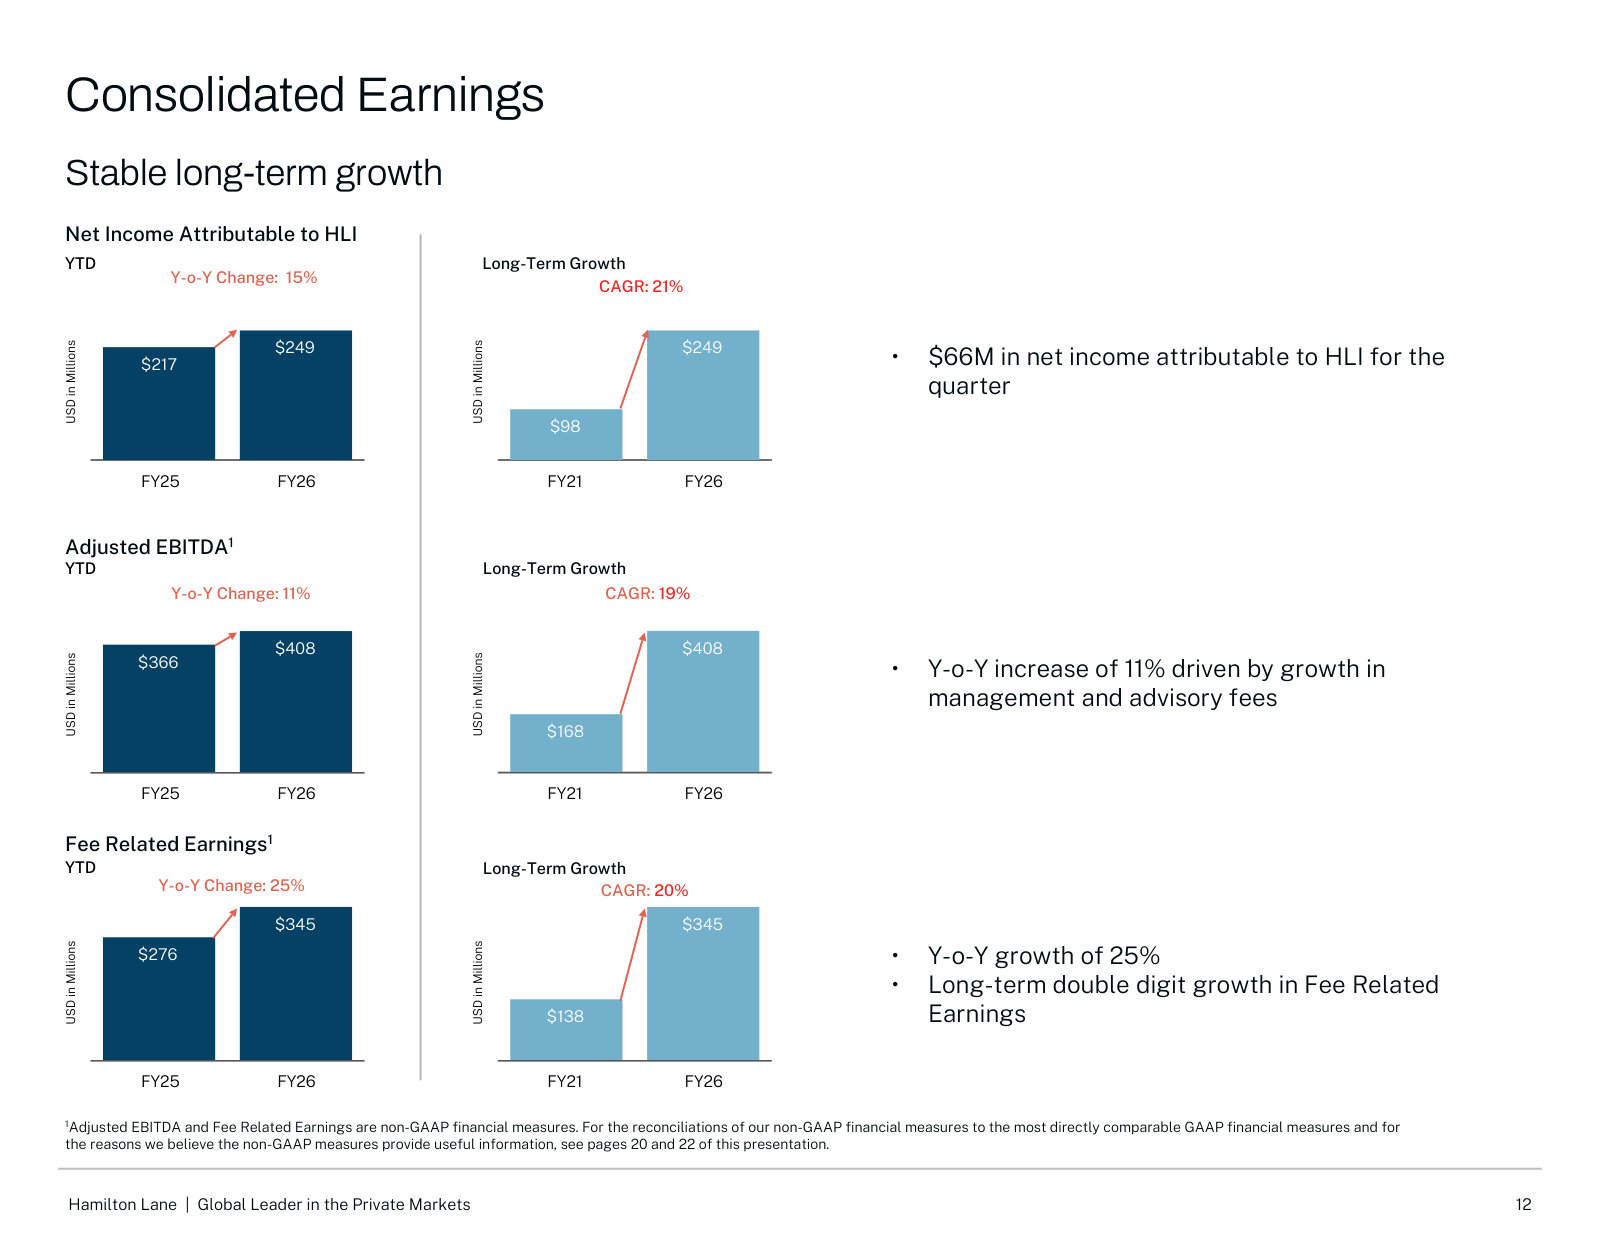
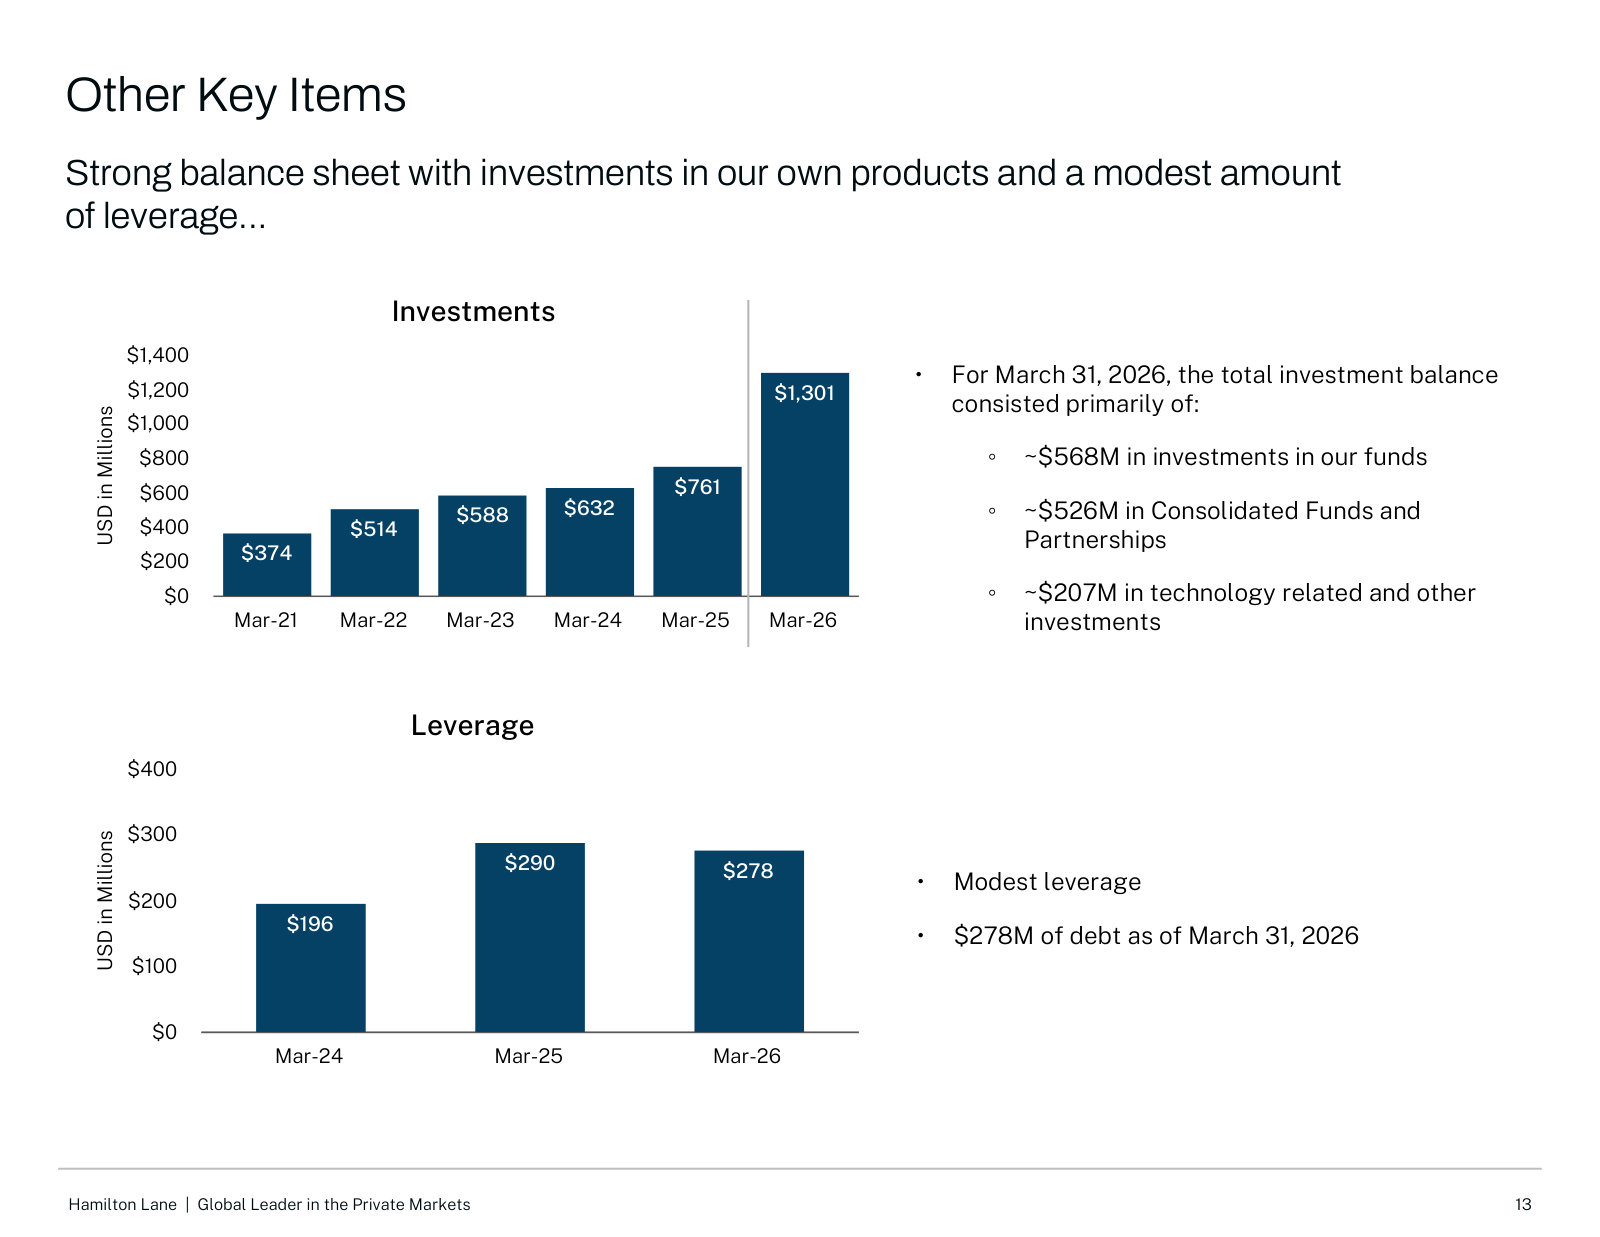
p. 5 — The full-year scorecard in one table: $142B AUM / $82B fee-earning AUM, management fees, EPS, Fee Related Earnings and Adjusted EBITDA. · Open the full presentation →p. 6 — AUM plus advisory assets from $6B in 2005 toward $1T, a 17% CAGR — the single clearest picture of the firm's scale and trajectory. · Open the full presentation →p. 7 — Fee-earning AUM split into Customized Separate Accounts and Specialized Funds, with the management-fee rate on average FEAUM rising from .59% to .67%. · Open the full presentation →p. 8 — The business explained: the three revenue lines — Customized Separate Accounts, Specialized Funds and Advisory Services — and what drives each. · Open the full presentation →p. 10 — Revenue mix and durability: recurring management and advisory fees are 75%+ of revenue; incentive fees are lumpier carry off 120+ funds. · Open the full presentation →p. 11 — Unrealized carried interest of $1.5B across 100+ vehicles, aged by vintage — the store of future incentive income and its timing risk. · Open the full presentation →p. 12 — Net income, Adjusted EBITDA and Fee Related Earnings, current year versus prior and versus FY21 — the long-run earnings-growth record. · Open the full presentation →p. 13 — Balance sheet: $1.3B invested largely in the firm's own funds against only $278M of debt — how HLI co-invests alongside clients. · Open the full presentation →
FY2025 Fourth Quarter & Full-Year Earnings Presentation — FY2025 · 22 pages · The prior-year snapshot ($135B AUM, $72B FEAUM) that FY2026's growth is measured against. · Open →
FY2024 Fourth Quarter & Full-Year Earnings Presentation — FY2024 · 22 pages · A two-years-back baseline for the same AUM, fee-rate and earnings series. · Open →
FY2023 First Quarter Earnings Presentation — FY2023 Q1 · 22 pages · The earliest deck in the corpus, showing the same template and the firm's scale four years ago. · Open →