Annual Reports
Hamilton Lane Incorporated's annual reports contain management's most considered account of the business. These are the sections, passages and visual pages worth opening in the originals preserved in Sources.
Hamilton Lane Incorporated — FY2026 Annual Report (Form 10-K) — FY2026
The latest 10-K: management's fullest account of a ~$1.0T private-markets platform, how it earns fees, and its evergreen and Up-C structure. · Open the full document →
Item 1. Business — Our Company — p. 10 · Read the full section →
The plain-English description of what Hamilton Lane is, does, and how big it is — the anchor for everything else.
Who they are: a global private-markets solutions provider with ~$142B AUM and ~$905B AUA.
We are a global private markets investment solutions provider dedicated to private markets investing. Since our founding in 1991, we have partnered with clients to design, implement and oversee portfolios of private markets funds and direct investments to help them access a diversified set of investment opportunities worldwide. As of March 31, 2026, we had approximately $142 billion of discretionary assets under management (“AUM”), and approximately $905 billion of nondiscretionary assets under advisement (“AUA”).
p. 10 · Read in context →
Assets Under Management and Advisement — p. 19 · Read the full section →
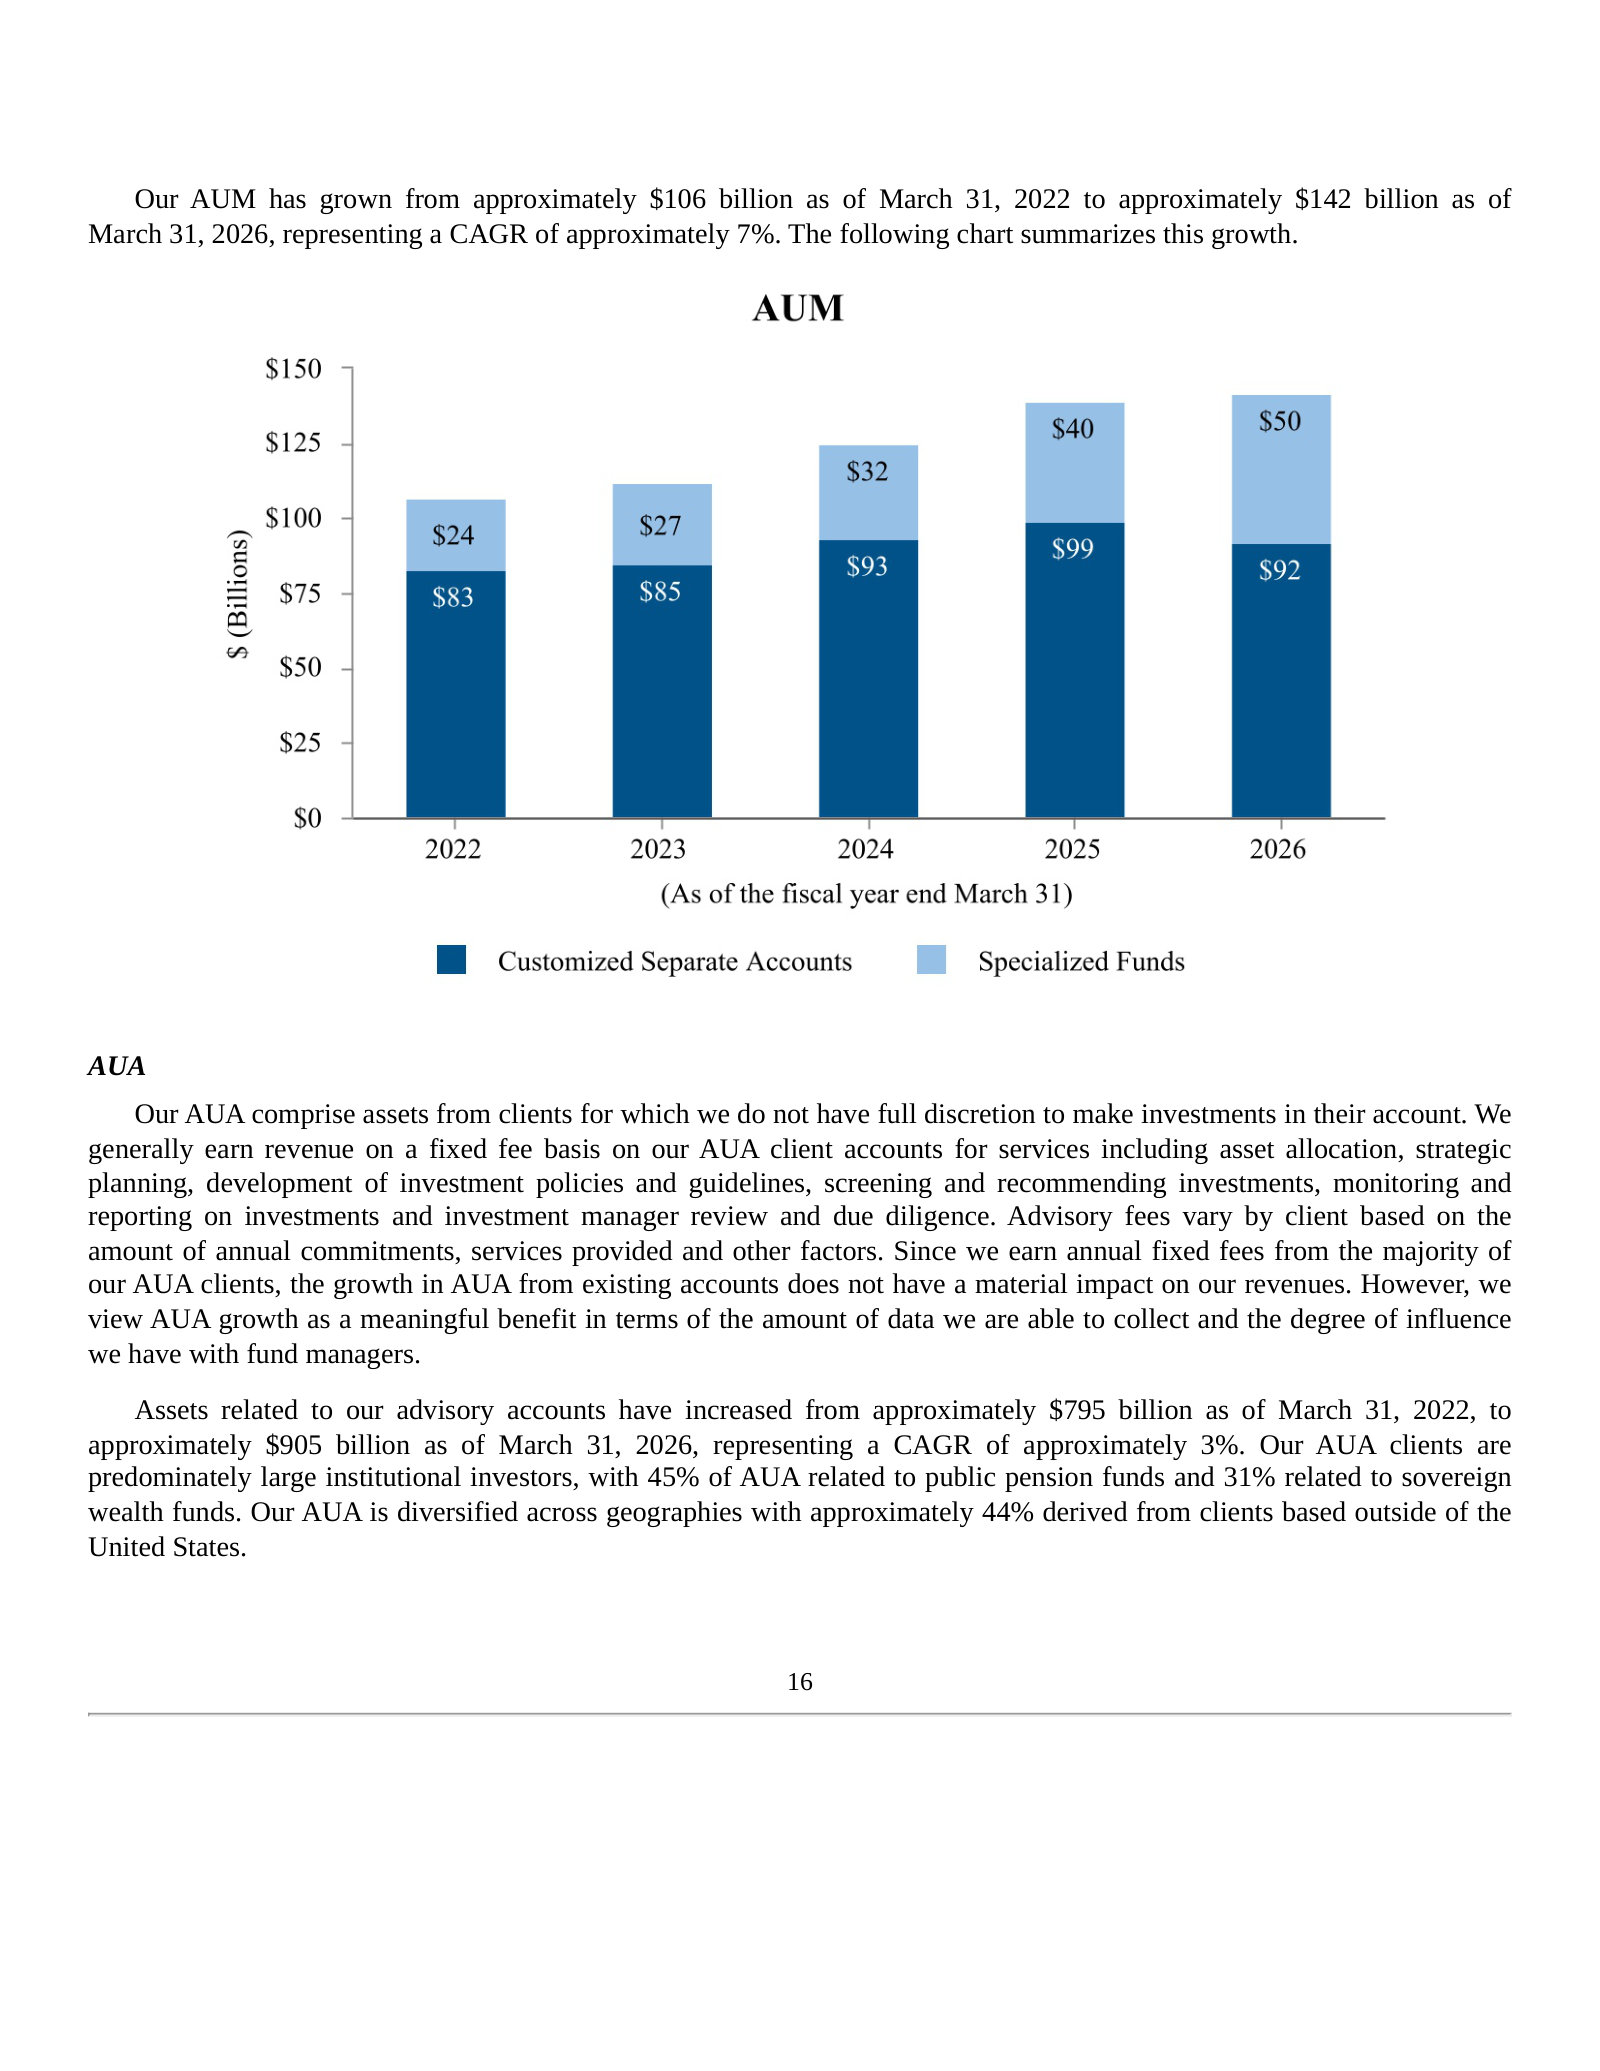
The franchise's scale and mix — discretionary AUM vs. advisory AUA — and where the growth is (specialized funds).
The ~$1.0T split: $142B discretionary AUM vs. $905B nondiscretionary AUA.
As of March 31, 2026, we had total AUA and AUM of approximately $1.0 trillion, of which $142 billion represents discretionary AUM from our customized separate accounts and specialized funds, and $905 billion represents nondiscretionary AUA managed on behalf of our advisory accounts.
p. 19 · Read in context →
Fees and Other Key Contractual Terms — p. 25 · Read the full section →
How the money is actually made: asset-based management fees that step down over a contract's life, plus incentive fees/carried interest.
Management fees on committed capital, invested capital or NAV — and why they decline over a mandate's life.
Fees. Generally our customized separate account clients are charged asset-based management fees annually on committed capital, net invested capital and/or net asset value (“NAV”), with the applicable fee base often transitioning over time in accordance with contractual terms. Fees frequently decrease over the life of the contract due to contractual stepdowns in fee rates and/or a reduction in applicable fee base as capital is returned to clients.
p. 25 · Read in context →
Item 1A. Risk Factors — p. 42 · Read the full section →
Two company-specific risks that could bite: redemptions from fast-growing evergreen funds, and full dependence on distributions from HLA.
Evergreen funds — now a bigger share of revenue — let investors redeem, unlike traditional drawdown funds.
Unlike traditional drawdown funds, which generally do not permit redemptions of fund interests until the liquidation of the fund upon scheduled termination dates, our evergreen funds, including our funds registered under the Investment Company Act, contain investor liquidity features that permit investors to redeem or repurchase their interests from time to time. Our evergreen funds have grown substantially in recent years and now represent a more significant portion of our AUM and our management and revenues.
p. 53 · Read in context →
Up-C structure: the public company's only material asset is its interest in HLA.
HLI is a holding company and has no material assets other than its ownership of membership units in HLA and certain deferred tax assets. As such, HLI does not have any independent means of generating revenue.
p. 84 · Read in context →
Item 7. MD&A — Revenues — p. 99 · Read the full section →
Where management explains what actually drove FY2026 results: evergreen funds powered fee growth while incentive fees fell.
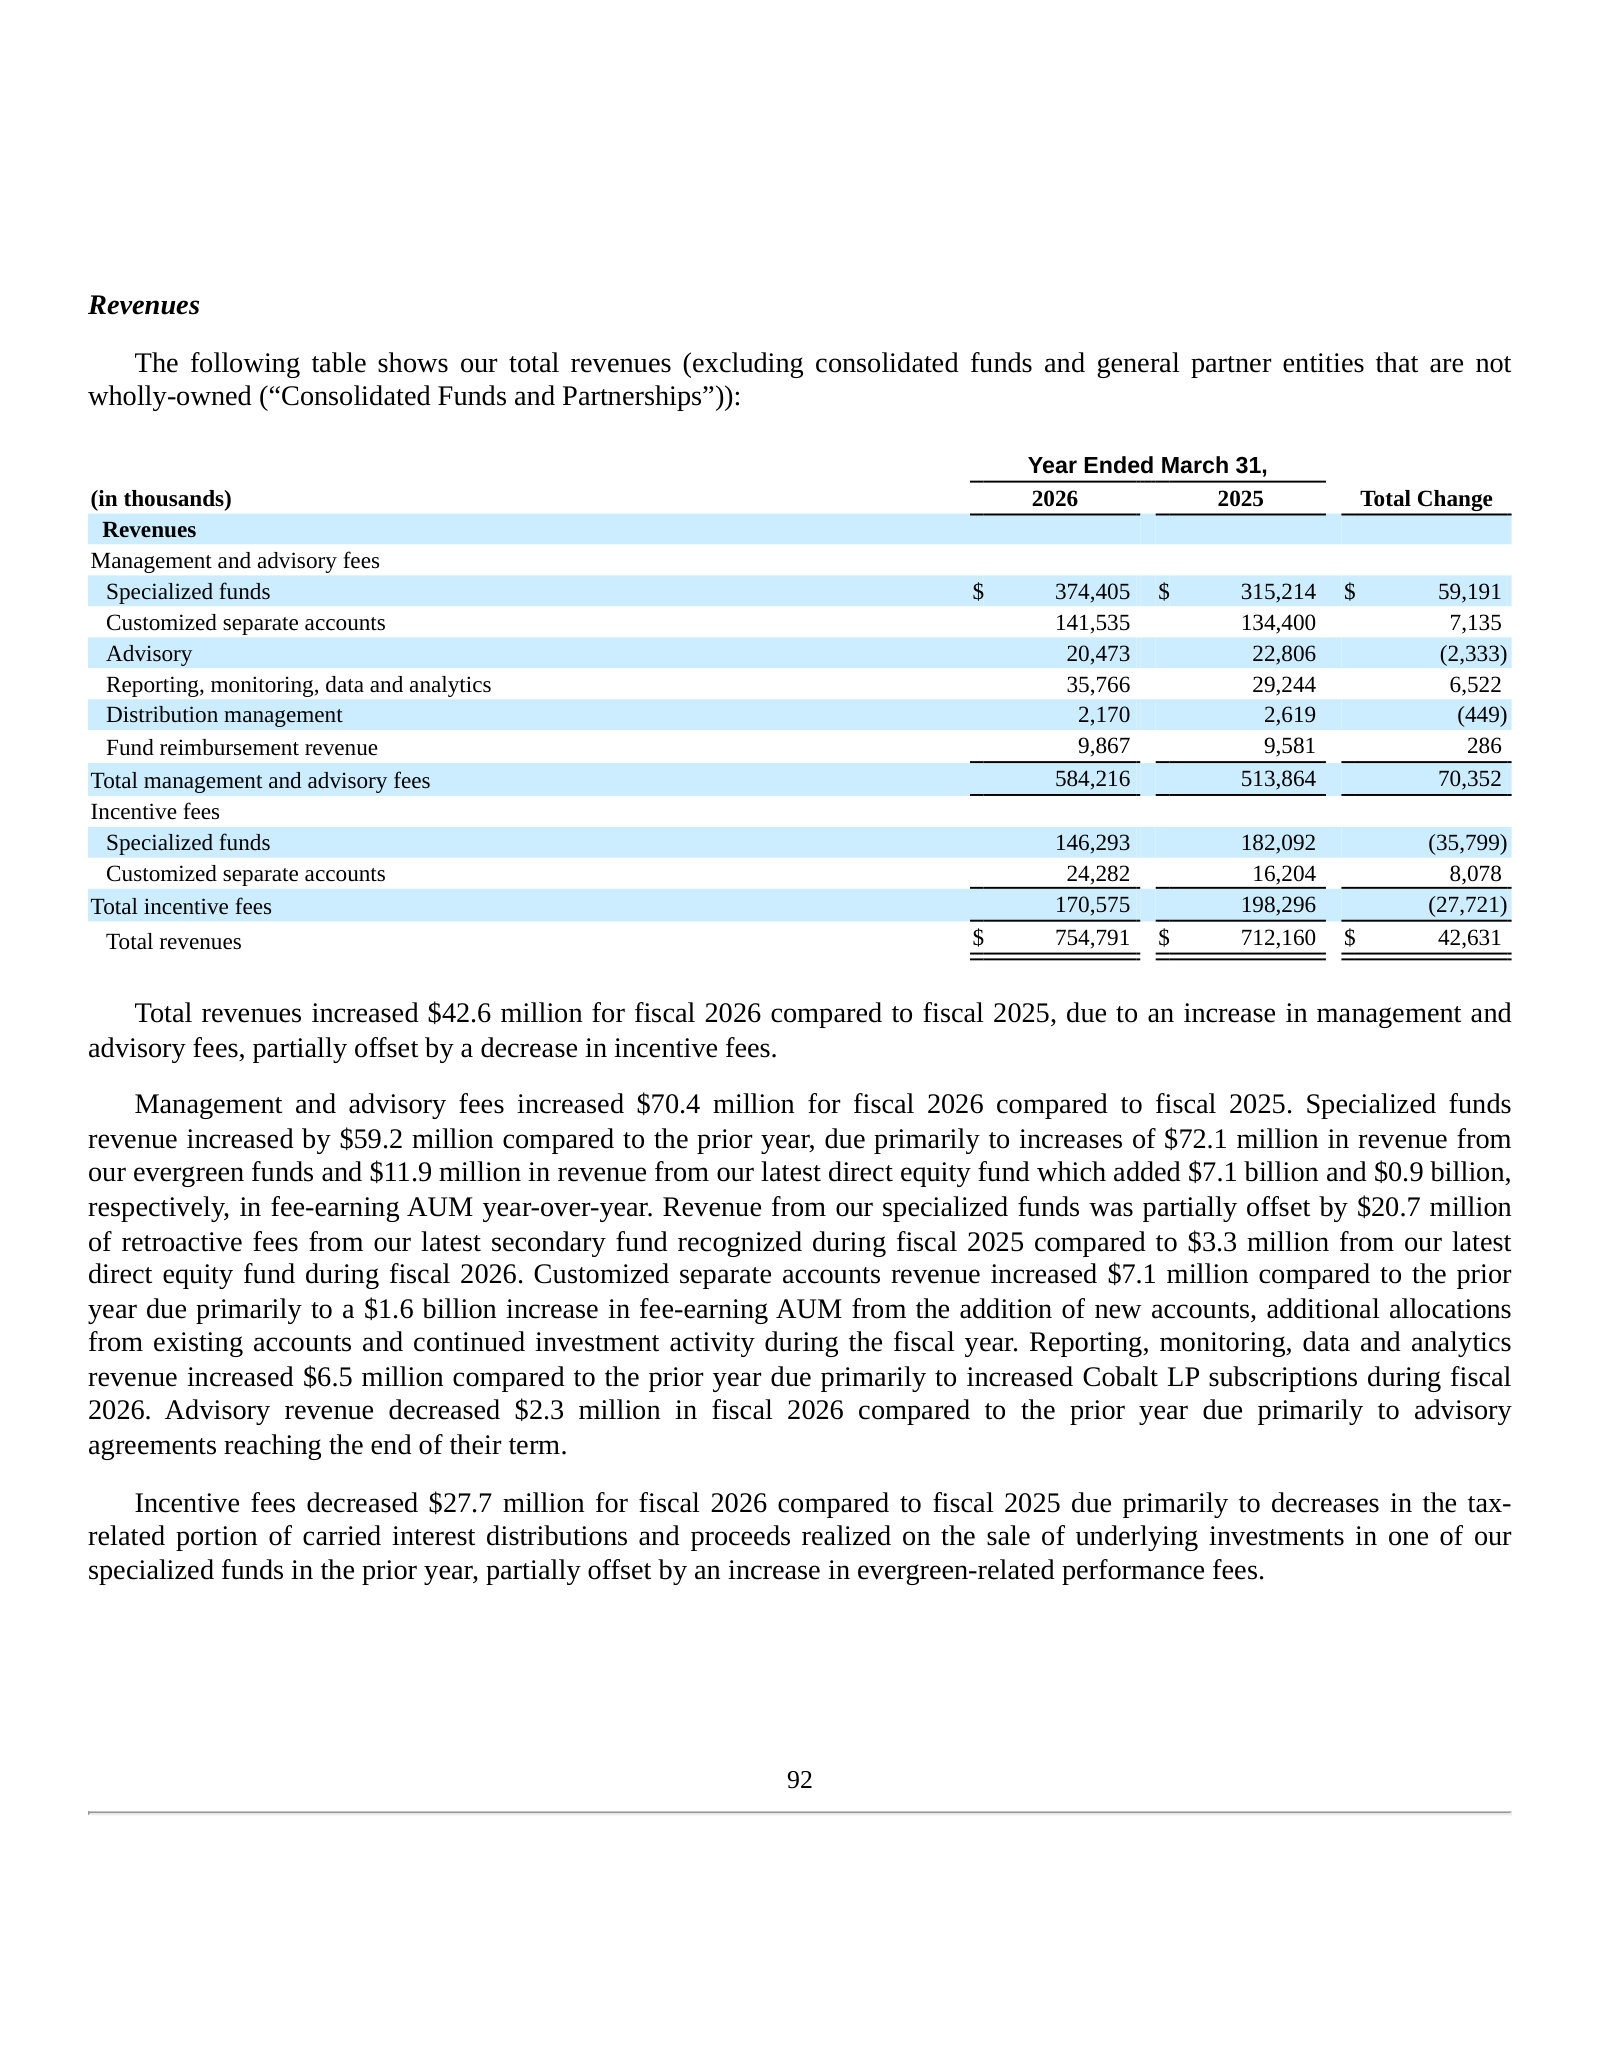
Fee growth of $70.4M led by $72.1M more from evergreen funds and new fee-earning AUM.
Total revenues increased $42.6 million for fiscal 2026 compared to fiscal 2025, due to an increase in management and advisory fees, partially offset by a decrease in incentive fees.
Management and advisory fees increased $70.4 million for fiscal 2026 compared to fiscal 2025. Specialized funds revenue increased by $59.2 million compared to the prior year, due primarily to increases of $72.1 million in revenue from our evergreen funds and $11.9 million in revenue from our latest direct equity fund which added $7.1 billion and $0.9 billion respectively, in fee-earning AUM year-over-year.
p. 109 · Read in context →
Non-GAAP Financial Measures — Fee Related Earnings — p. 115 · Read the full section →
The metric investors track most: FRE strips out variable incentive fees to isolate recurring fee profitability (revised Q4 FY2025).
What FRE is and what it excludes — the firm's measure of recurring earnings power.
Fee Related Earnings (“FRE”) is used to highlight earnings from revenues that are measured and received on a recurring basis. FRE represents net income excluding (a) incentive fees, net of fee related performance revenues, and related compensation, (b) equity-based compensation, (c) interest income and expense, (d) income tax expense, (e) equity in income of investees, (f) non-operating gain (loss), net and (g) certain other significant items that we believe are not indicative of our core performance.
p. 115 · Read in context →
Critical Accounting Estimates — Revenue Recognition of Incentive Fees — p. 127 · Read the full section →
Incentive fees define the upside and its variability: carried interest is recognized subject to clawback, with $1.5B still unrecognized.
$174.8M of incentive fees recognized in FY2026, against $1.5B of unrecognized carried interest.
Incentive fees include both carried interest and performance fees earned from certain specialized funds and customized separate accounts. We recognized $174.8 million of incentive fees in fiscal 2026 and have $1.5 billion of unrecognized carried interest as of March 31, 2026.
p. 127 · Read in context →
More annual reports
Hamilton Lane Incorporated — FY2025 Annual Report (Form 10-K) — FY2025 · 193 pages · Prior year: introduced the revised FRE definition (excluding equity-based comp, adding FRPR) restated across periods. · Open →
Hamilton Lane Incorporated — FY2024 Annual Report (Form 10-K) — FY2024 · 192 pages · Captures the earlier build-out of the private-wealth and evergreen platform before it became the main growth driver. · Open →
Hamilton Lane Incorporated — FY2023 Annual Report (Form 10-K) — FY2023 · 171 pages · Baseline year for the AUM-mix shift, with specialized funds at ~$27B versus $50B by FY2026. · Open →
Hamilton Lane Incorporated — FY2022 Annual Report (Form 10-K) — FY2022 · 166 pages · Earliest edition on the shelf (~$106B AUM), the starting point for the five-year growth story. · Open →