Full Report
The numbers behind Hamilton Lane Incorporated: as-reported financial statements and company metrics for FY2022–FY2026, traced to the source filings, opened with the share-price history those statements have to justify. Every linked figure opens the exact page of the filing it was printed on, with the statement row highlighted. Amounts in US$ thousands unless noted.
Reading notes: All figures are in thousands of US dollars, as printed on the face of the consolidated financial statements ('In thousands, except per share amounts'). Per-share values are as printed. Hamilton Lane's fiscal year ends March 31. Each fiscal year in the FY2022–FY2026 columns is cited to that year's own Form 10-K; every core-statement cell in those columns was page-verified against the index JSON page content. On the face of the income statement, revenue is disaggregated into Management and advisory fees, Incentive fees, and a smaller Consolidated Funds and Partnerships incentive-fee line (labeled 'Consolidated variable interest entities related: Incentive fees' in FY2022–FY2025 and 'Consolidated Funds and Partnerships: Incentive fees' in FY2026); the three sum to Total revenues. HLNE does not present Goodwill or Intangible assets as separate line items on the face of its Consolidated Balance Sheets, so no such rows are shown.
Share Price — Full Available History — 9 Years
The stock closed at $83.16 on Jul 24, 2026 — up 361% over the window shown (+17.7% a year), trading between $18.02 and $201.62. At that close the stock trades at 14× FY2026 diluted EPS as reported below.
Source: market price feed, weekly closes, sampled from 2,364 source observations, Mar 2017–Jul 2026. Price return only, excludes dividends.
FY2026 at a Glance
Revenue (US$ thousands)
Net income (US$ thousands)
Diluted EPS
Source: FY2026 consolidated statements [1] [2] [3] [4]. Click any linked figure to open the filing page with the row highlighted.
Revenue by Type
| Revenue by Type | FY2022 | FY2023 | FY2024 | FY2025 | FY2026 |
|---|---|---|---|---|---|
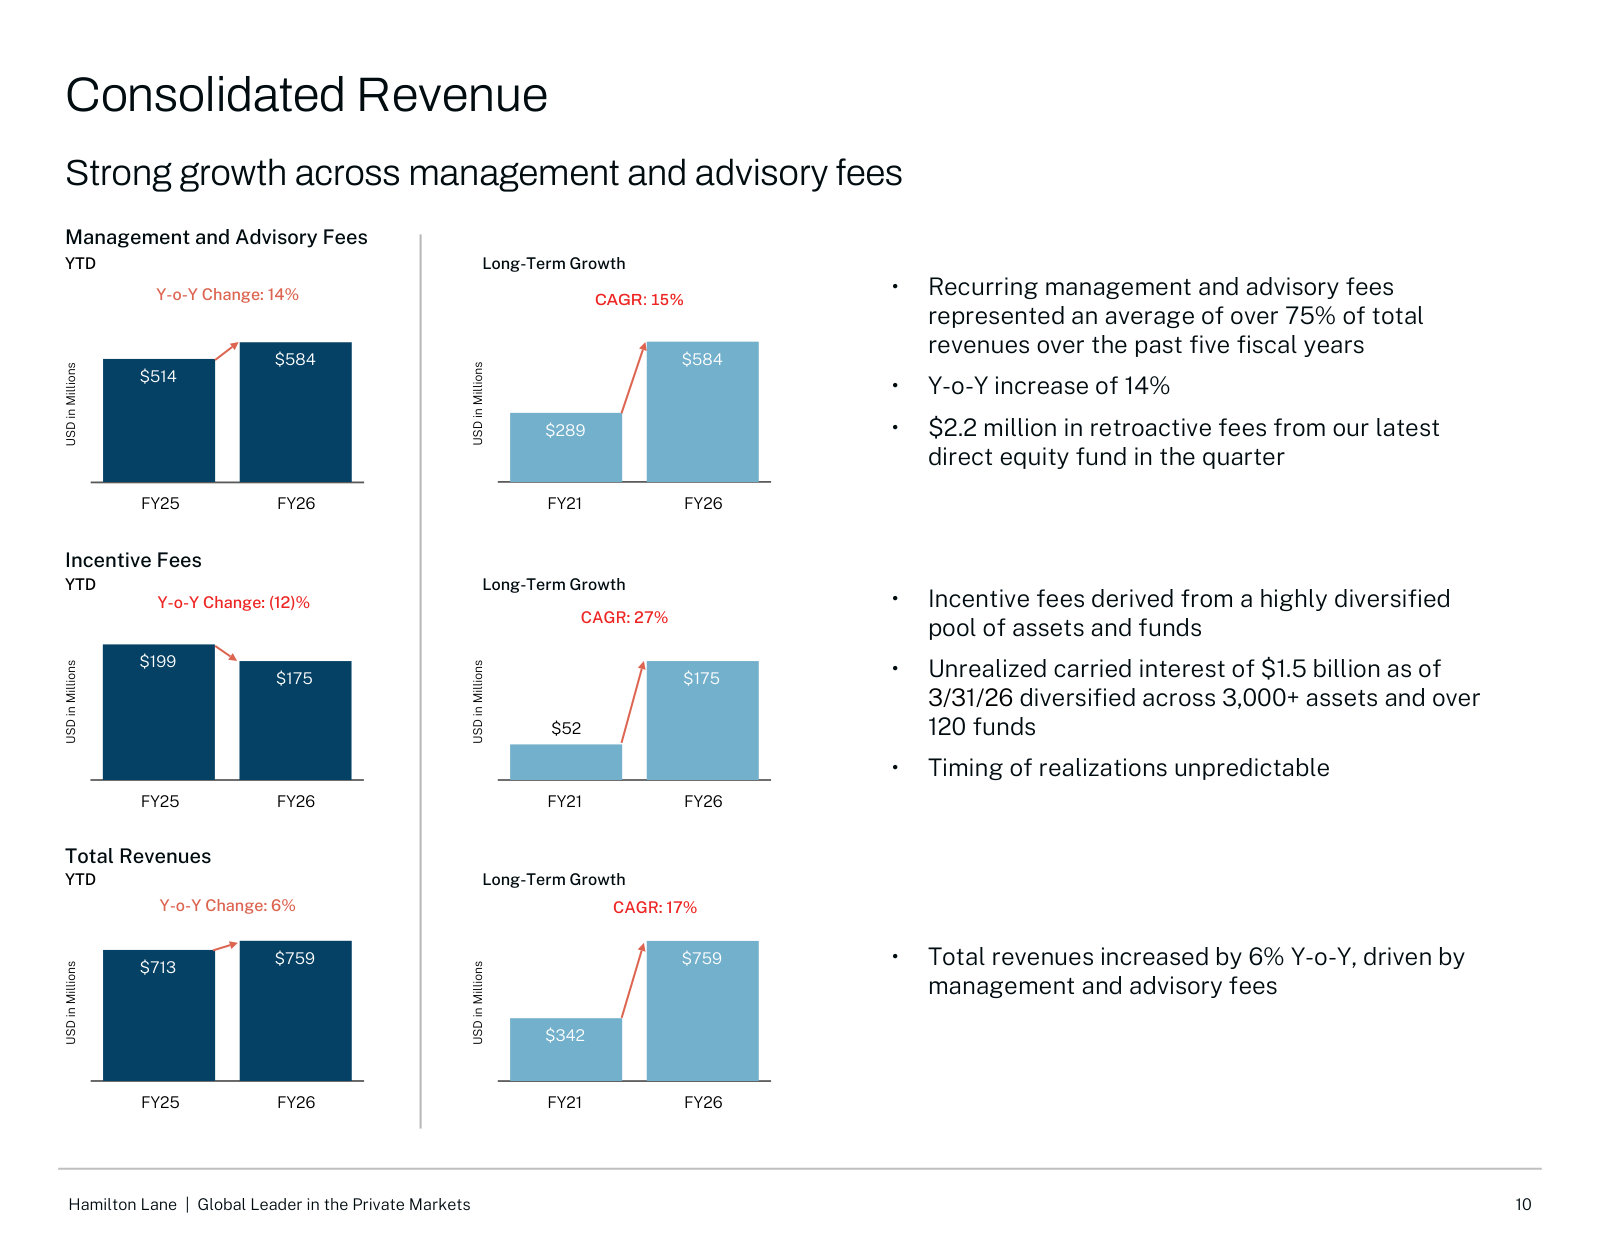
| Management and advisory fees | 314,228 | 371,874 | 451,936 | 513,864 | 584,216 |
| Incentive fees | 48,133 | 149,931 | 101,906 | 198,296 | 170,575 |
| Incentive fees — Consolidated Funds and Partnerships | 5,558 | 6,948 | — | 803 | 4,202 |
| Total revenues | 367,919 | 528,753 | 553,842 | 712,963 | 758,993 |
| Total revenues growth, derived | — | +43.7% | +4.7% | +28.7% | +6.5% |
Source: Consolidated Statements of Income — revenue lines [1] [2] [3] [4]. Click any linked figure to open the filing page with the row highlighted.
Income Statement
Source: Consolidated Statements of Income [1] [2] [3] [4]. Click any linked figure to open the filing page with the row highlighted.
Columns marked E are consensus analyst estimates from S&P Capital IQ (CapIQ), shown alongside reported results for direct comparison; they are not company guidance.
Estimate source: S&P Capital IQ (CapIQ) consensus, as of 2026-07-25. Estimate figures are S&P Capital IQ consensus (vendor data — no filing page links). EPS and net income use the normalized (adjusted) consensus where the street reports it. Line-item analyst models (segments, drivers, KPIs) are in the Visible Alpha tab.
Balance Sheet
Source: Consolidated Balance Sheets [5] [6] [7] [8]. Click any linked figure to open the filing page with the row highlighted.
Cash Flow
Source: Consolidated Statements of Cash Flows [9] [10] [11] [12]. Click any linked figure to open the filing page with the row highlighted.
Revenue by Geography
| Revenue by Geography | FY2022 | FY2023 | FY2024 | FY2025 | FY2026 |
|---|---|---|---|---|---|
| United States | 178,250 | 207,954 | 224,700 | 314,608 | 310,354 |
| Other foreign countries | 189,669 | 320,799 | 329,142 | 398,355 | 448,639 |
| Total revenues | 367,919 | 528,753 | 553,842 | 712,963 | 758,993 |
Source: Revenues by geographic location (revenue note) [13] [14] [15] [16]. Click any linked figure to open the filing page with the row highlighted.
Assets Under Management Advisement
| Assets Under Management Advisement | FY2022 | FY2023 | FY2024 | FY2025 | FY2026 |
|---|---|---|---|---|---|
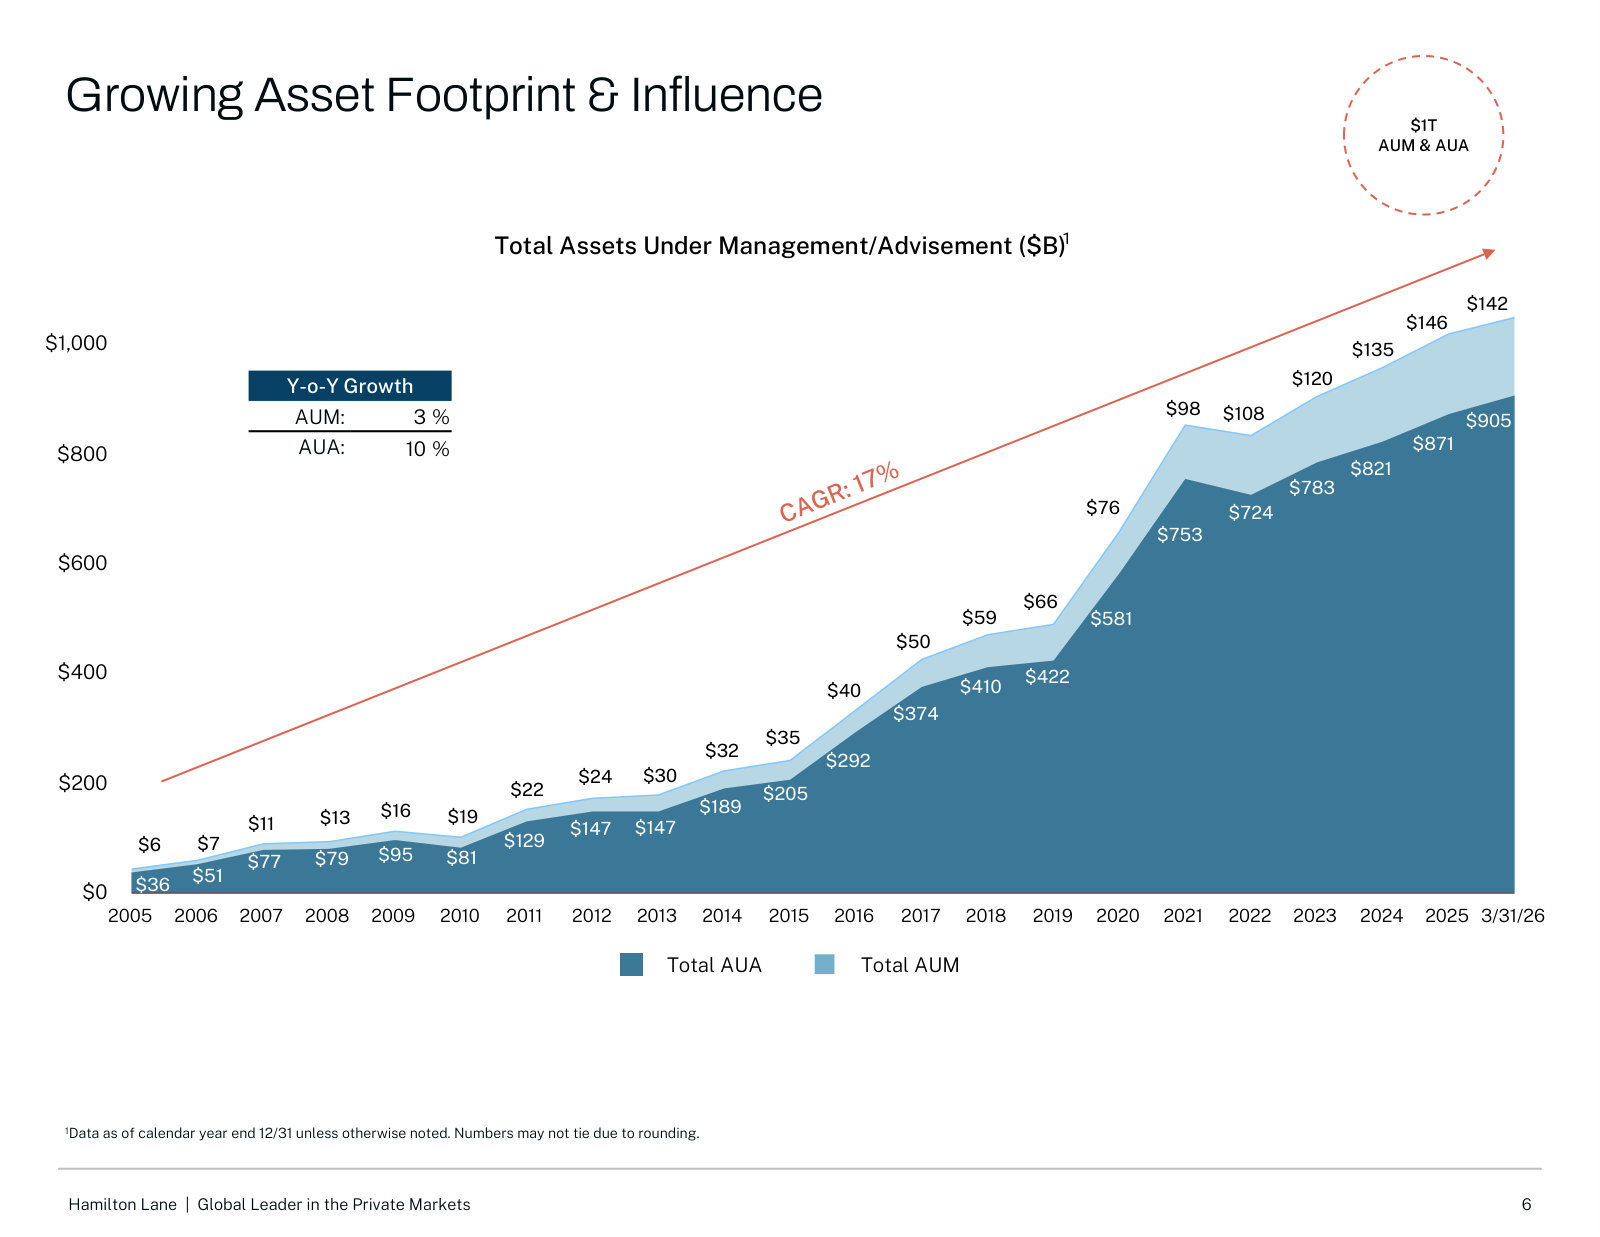
| Discretionary assets under management (AUM) | 106,000,000 | 112,000,000 | 124,000,000 | 138,000,000 | 142,000,000 |
| Non-discretionary assets under advisement (AUA) | 795,000,000 | 745,000,000 | 796,000,000 | 819,000,000 | 905,000,000 |
| Total asset footprint (AUM + AUA) | — | — | — | — | 1,000,000,000 |
Source: company filings [17] [18] [19] [20]. Click any linked figure to open the filing page with the row highlighted.
Fee-Earning AUM (Management-Fee Base)
| Fee-Earning AUM (Management-Fee Base) | FY2022 | FY2023 | FY2024 | FY2025 | FY2026 |
|---|---|---|---|---|---|
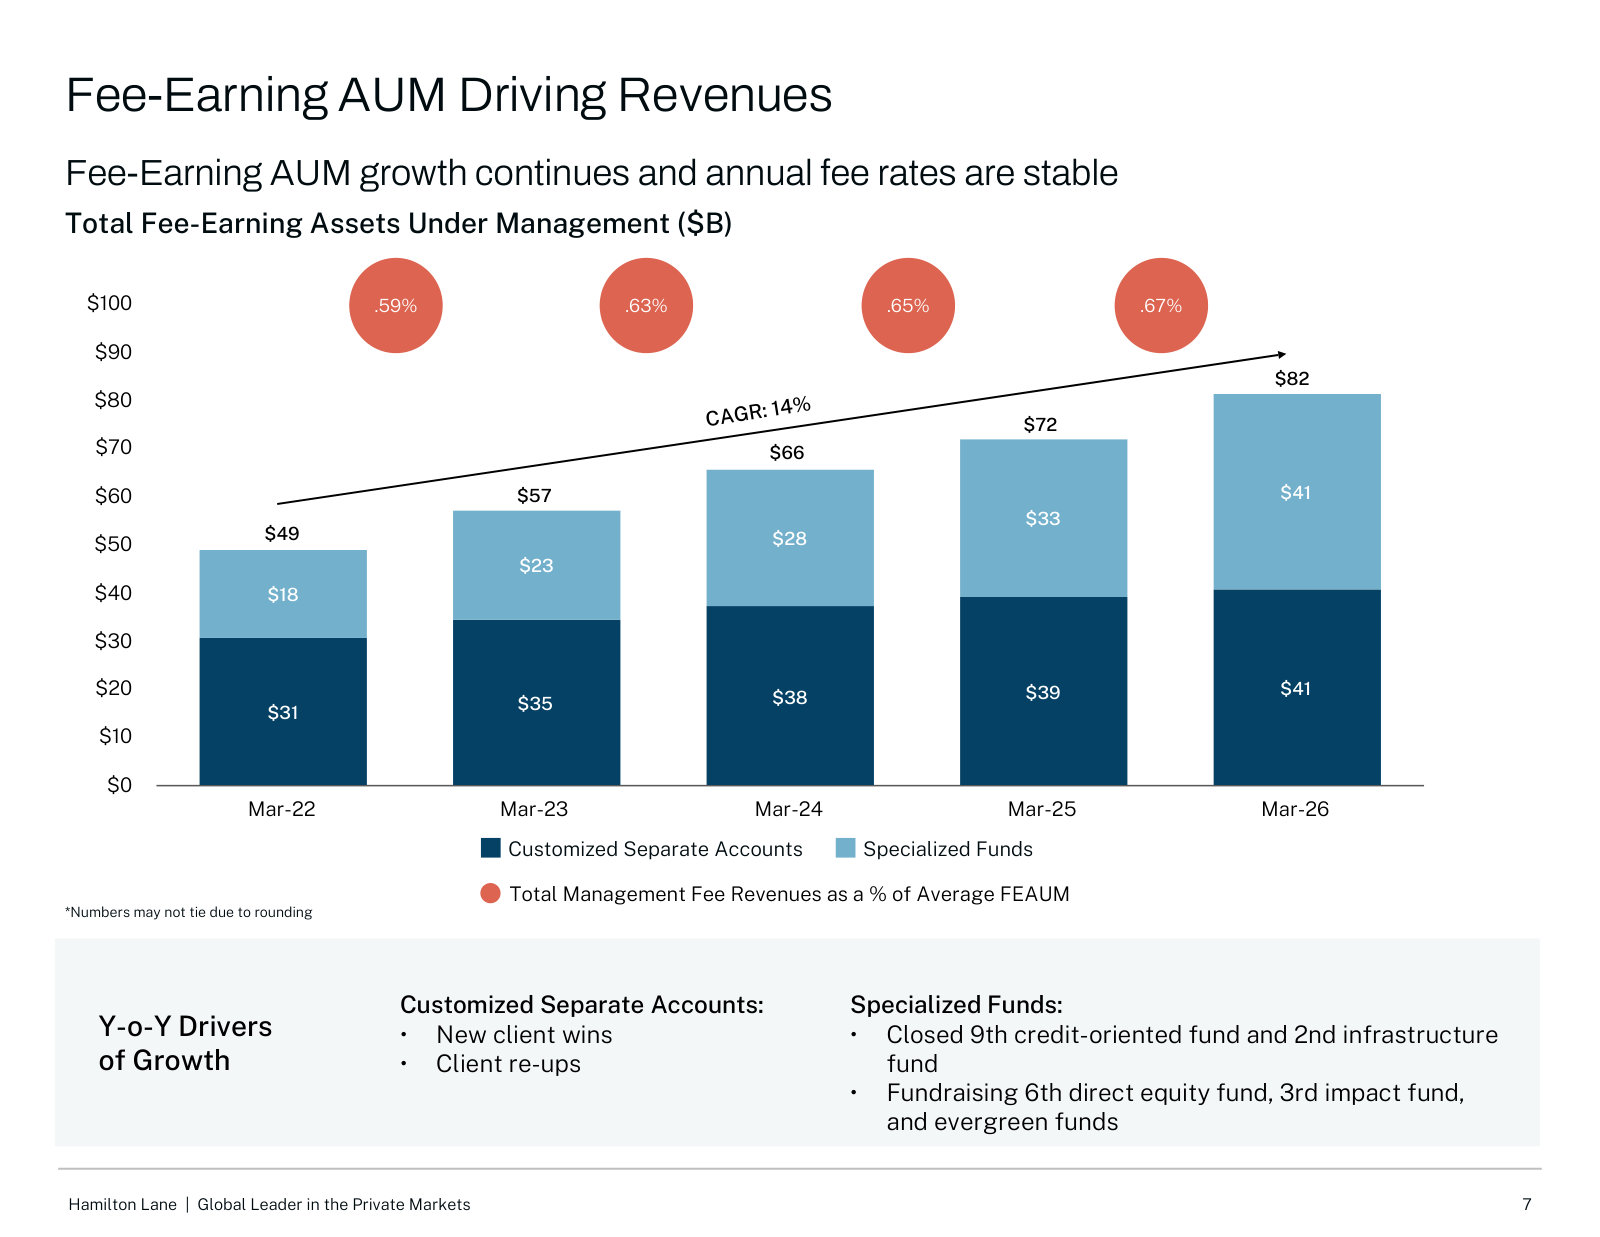
| Total fee-earning AUM | 49,131,000 | 57,346,000 | 65,749,000 | 72,047,000 | 81,512,000 |
| Fee-earning AUM — Customized Separate Accounts | 30,938,000 | 34,684,000 | 37,574,000 | 39,343,000 | 40,943,000 |
| Fee-earning AUM — Specialized Funds | 18,193,000 | 22,662,000 | 28,175,000 | 32,704,000 | 40,569,000 |
| Fee-earning AUM contributions (gross annual inflows) | 13,222,000 | 12,900,000 | 13,887,000 | 13,776,000 | 14,984,000 |
| Fee-earning AUM distributions (annual outflows) | (6,778,000) | (4,979,000) | (6,135,000) | (8,171,000) | (7,607,000) |
Source: company filings [21] [22] [23] [24]. Click any linked figure to open the filing page with the row highlighted.
Client Franchise People
| Client Franchise People | FY2022 | FY2023 | FY2024 | FY2025 | FY2026 |
|---|---|---|---|---|---|
| Client investor base (institutions and intermediaries) | 800 | 1,000 | 1,800 | 2,300 | 2,800 |
| Employees | 540 | 600 | 700 | 760 | 785 |
| Investment professionals | — | — | 238 | 265 | 265 |
Source: company filings [25] [18] [26] [19]. Click any linked figure to open the filing page with the row highlighted.
Long-Term Record
| Fiscal year | Total revenues | Management and advisory fees | Net income attributable to Hamilton Lane Incorporated | Diluted earnings per share of Class A common stock | Fee Related Earnings |
|---|---|---|---|---|---|
| FY2017 | 179,820 | 172,674 | 612 | — | 72,252 |
| FY2018 | 244,033 | 195,030 | 17,341 | — | 81,223 |
| FY2019 | 252,179 | 217,773 | 33,573 | 1.40 | 89,901 |
| FY2020 | 274,048 | 244,920 | 60,825 | 2.15 | 109,310 |
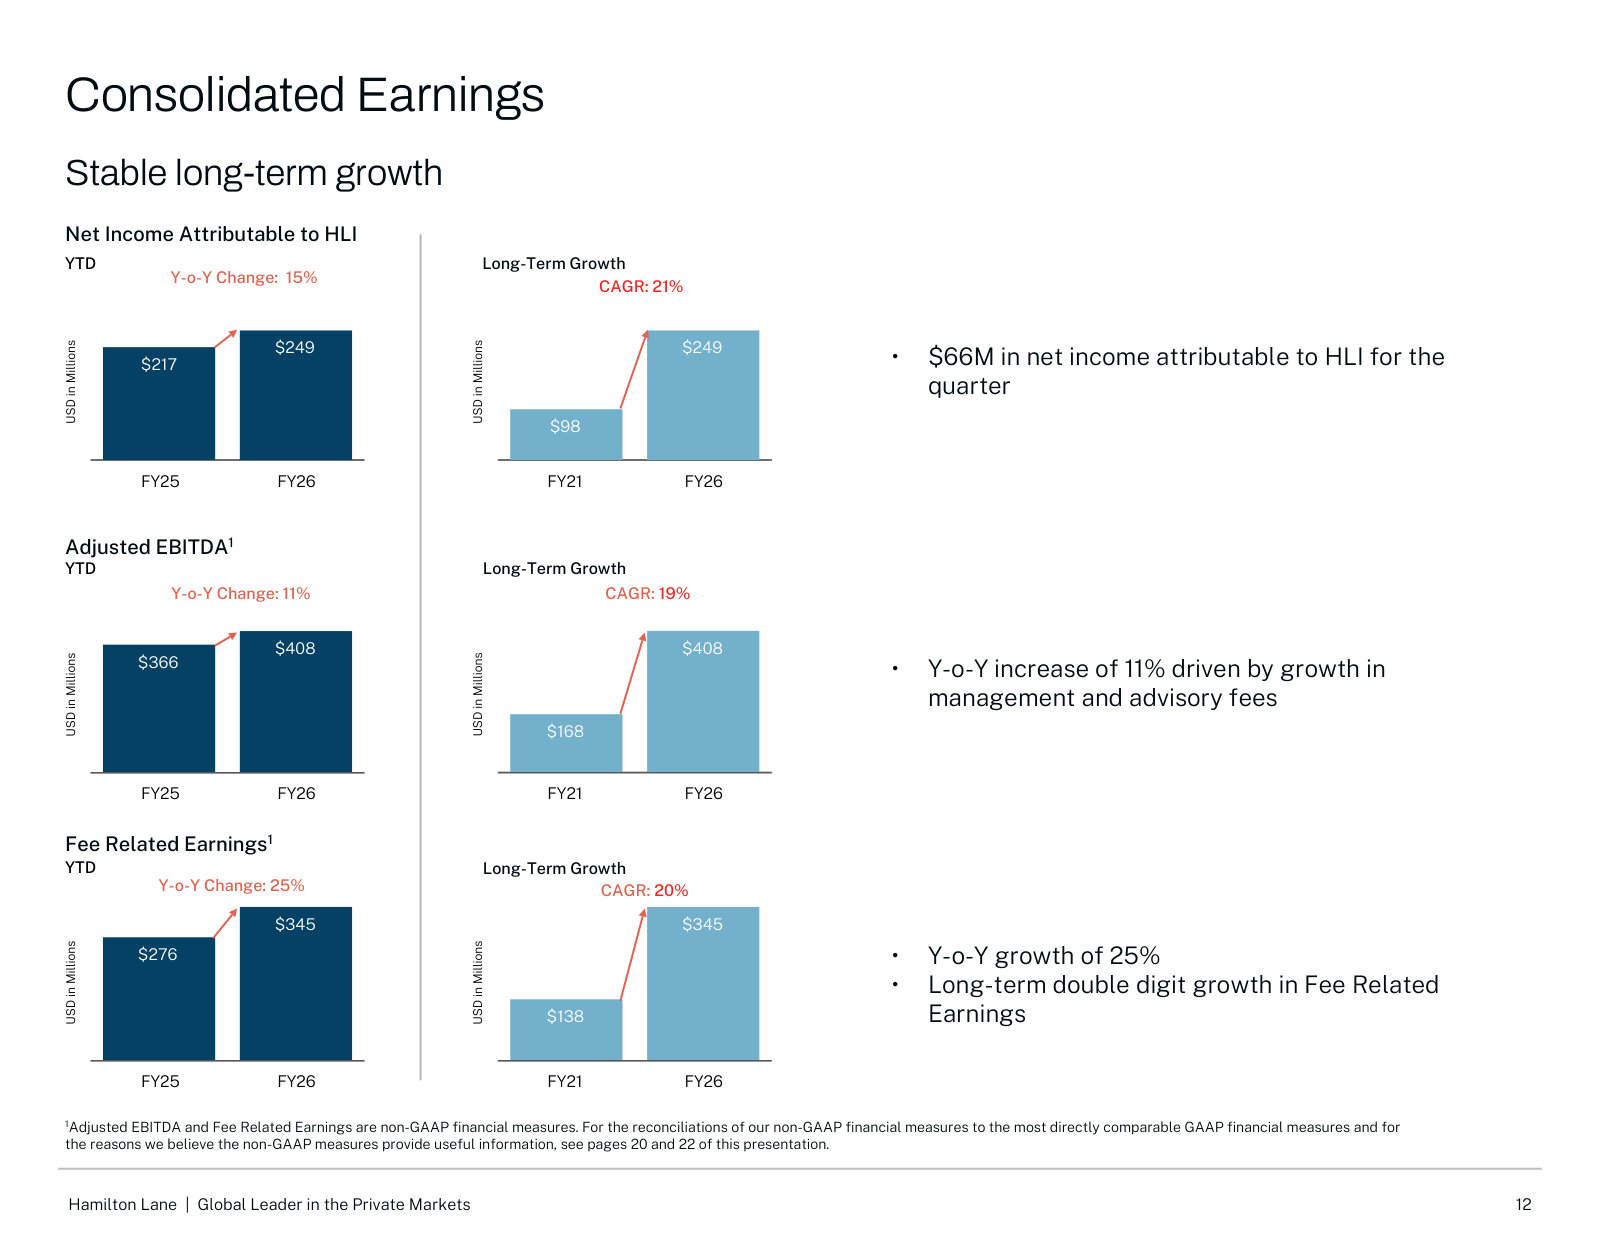
| FY2021 | 341,635 | 289,444 | 98,022 | 2.81 | 130,039 |
| FY2022 | 367,919 | 314,228 | 145,986 | 3.98 | 144,254 |
| FY2023 | 528,753 | 371,874 | 109,120 | 3.01 | 158,809 |
| FY2024 | 553,842 | 451,936 | 140,858 | 3.69 | 206,719 |
| FY2025 | 712,963 | 513,864 | 217,417 | 5.41 | 276,465 |
| FY2026 | 758,993 | 584,216 | 249,180 | 5.92 | 344,510 |
Source: consolidated statements across filings; older years from the standardized feed [1] [2] [3] [4]. Click any linked figure to open the filing page with the row highlighted.
Operating KPIs
| KPI | FY2022 | FY2023 | FY2024 | FY2025 | FY2026 |
|---|---|---|---|---|---|
| Total assets under management (AUM) | 106,382,000,000 | 111,901,000,000 | 124,406,000,000 | 138,295,000,000 | 141,834,000,000 |
| Total assets under advisement (AUA) | 794,732,000,000 | 744,770,000,000 | 796,173,000,000 | 819,473,000,000 | 905,317,000,000 |
| Total fee-earning assets under management (FAUM) | 49,131,000,000 | 57,346,000,000 | 65,749,000,000 | 72,047,000,000 | 81,512,000,000 |
Source: standardized company data feed — these figures carry no page links.
Analyst Consensus
Mean target
Median target
High target
Low target
Street ratings: 4 strong buy, 2 buy, 1 hold. Consensus: Buy.
Estimate source: S&P Capital IQ (CapIQ) consensus, as of 2026-07-25. Estimate figures are S&P Capital IQ consensus (vendor data — no filing page links). EPS and net income use the normalized (adjusted) consensus where the street reports it. Line-item analyst models (segments, drivers, KPIs) are in the Visible Alpha tab.
Traceability
326 of 409 figures on this page (80%) link to the filing page where they are printed — click a linked figure to open the source PDF at that page with the row highlighted. Unlinked figures come from standardized data feeds or pre-filing years.
All figures are in thousands of US dollars, as printed on the face of the consolidated financial statements ('In thousands, except per share amounts'). Per-share values are as printed.
Hamilton Lane's fiscal year ends March 31. Each fiscal year in the FY2022–FY2026 columns is cited to that year's own Form 10-K; every core-statement cell in those columns was page-verified against the index JSON page content.
On the face of the income statement, revenue is disaggregated into Management and advisory fees, Incentive fees, and a smaller Consolidated Funds and Partnerships incentive-fee line (labeled 'Consolidated variable interest entities related: Incentive fees' in FY2022–FY2025 and 'Consolidated Funds and Partnerships: Incentive fees' in FY2026); the three sum to Total revenues.
HLNE does not present Goodwill or Intangible assets as separate line items on the face of its Consolidated Balance Sheets, so no such rows are shown.
The FY2024 Form 10-K did not disaggregate revenue by geography; the FY2024 revenue-by-geography column is taken from the comparative column of the FY2025 Form 10-K (Revenues by geographic location note).
The 'Net income' line is total consolidated net income including non-controlling interests; 'Net income attributable to Hamilton Lane Incorporated' is the portion attributable to Class A shareholders. The standardized data feed's 'net_income' equals the attributable line and reconciles to the filings.
FY2017–FY2021 long-term figures and all AUM/AUA/fee-earning AUM KPIs and Fee Related Earnings come from the standardized data feed (SEC XBRL / provider) and are shown without page links; Fee Related Earnings and AUM/AUA/FAUM are provider-sourced (Fee Related Earnings is a non-GAAP measure).
Quarterly income-statement figures are the single-quarter (three-month) columns from each Form 10-Q; quarterly balance sheets are point-in-time. Quarterly cash flows (printed year-to-date only in the 10-Qs) are omitted; the renderer falls back to the numeric feed for quarterly cash flow.
Hamilton Lane Incorporated's management explains the business in its own materials. The slides below do the most of that work, pulled from the documents preserved in Sources. Each source link opens the complete presentation at that slide in a new tab.
FY2026 Fourth Quarter & Full-Year Earnings Presentation — FY2026
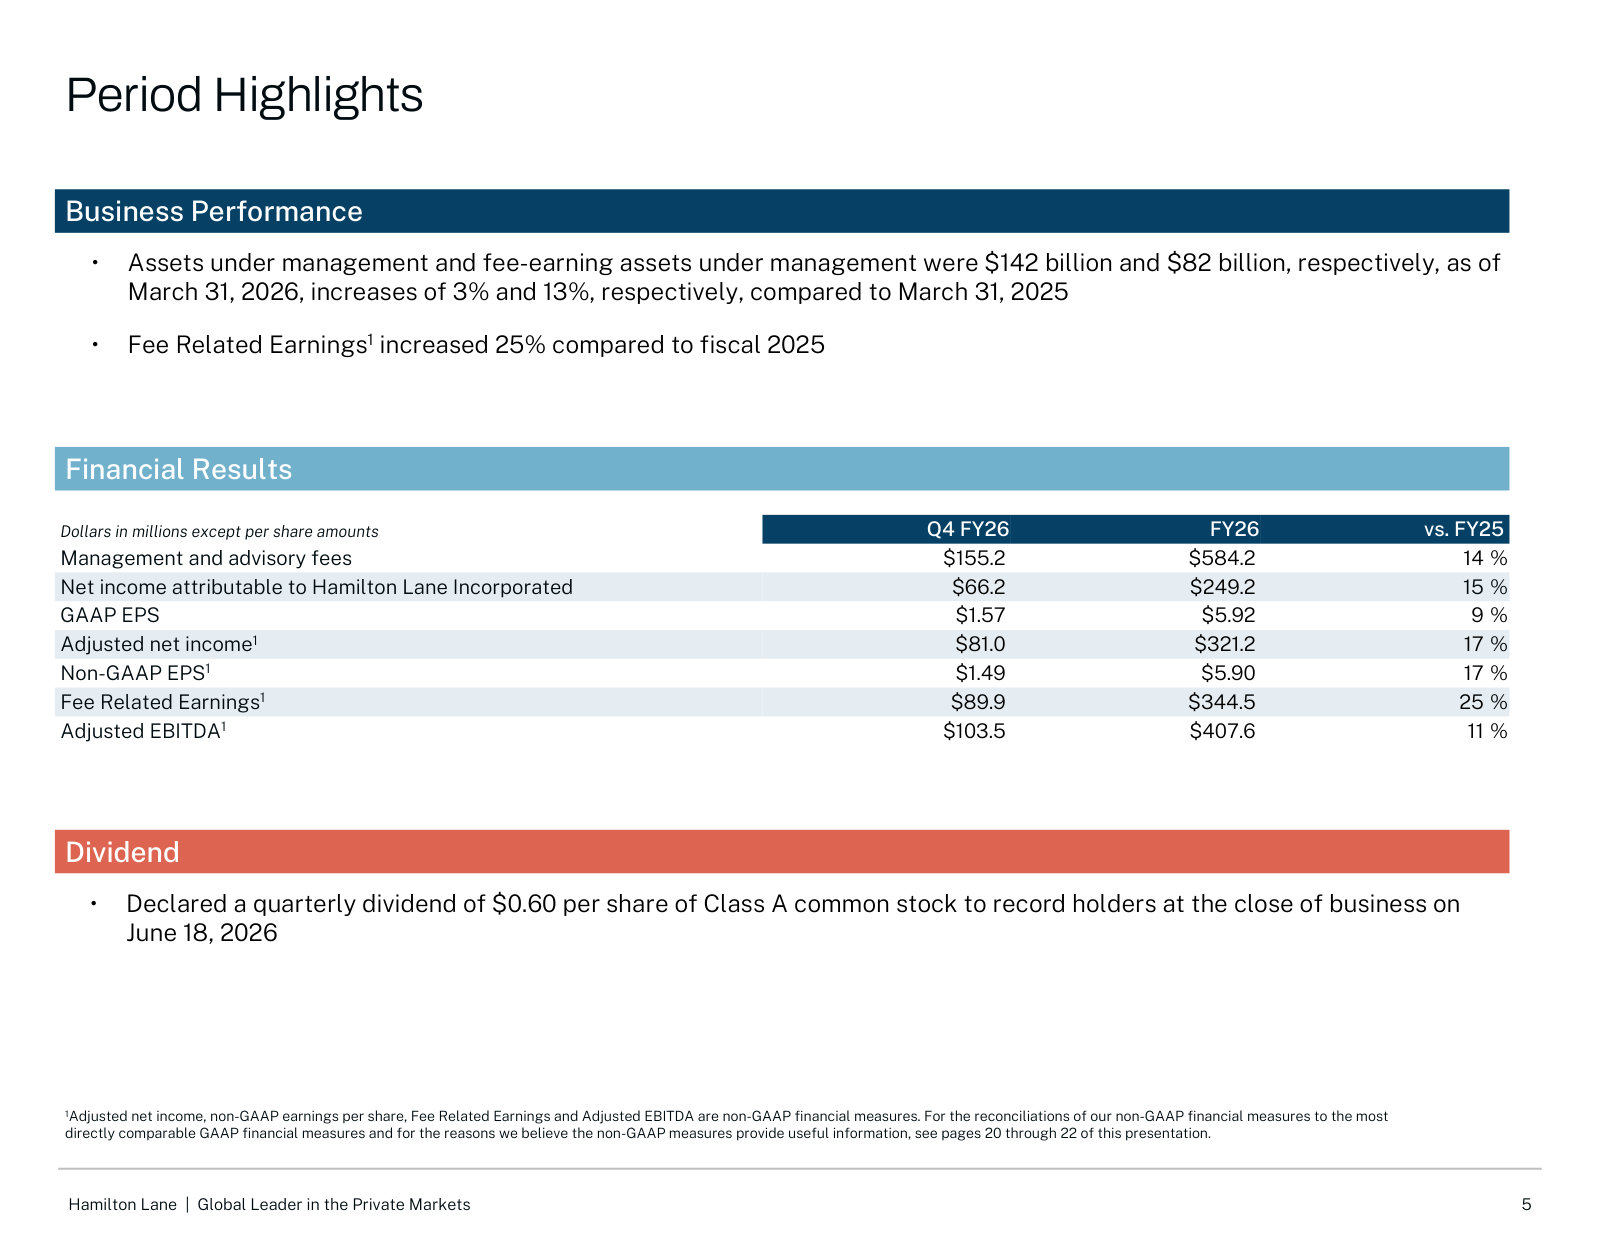
Hamilton Lane's newest and fullest quarterly deck: what the firm manages, how the three product lines earn fees, and how those fees convert to earnings. · Open the full document →
More from management
FY2025 Fourth Quarter & Full-Year Earnings Presentation — FY2025 · 22 pages · The prior-year snapshot ($135B AUM, $72B FEAUM) that FY2026's growth is measured against. · Open →
FY2024 Fourth Quarter & Full-Year Earnings Presentation — FY2024 · 22 pages · A two-years-back baseline for the same AUM, fee-rate and earnings series. · Open →
FY2023 First Quarter Earnings Presentation — FY2023 Q1 · 22 pages · The earliest deck in the corpus, showing the same template and the firm's scale four years ago. · Open →
Hamilton Lane Incorporated's management answers for the business every quarter. These are the exchanges that explain it best — verbatim, from the call transcripts preserved in Sources. Each link opens the full transcript at that page in a new tab.
Q4 & Full Year FY2026 Earnings Call — Q4 FY2026
The most recent call and a secondaries masterclass: how discounts actually work, why the wide dispersion between managers is the whole reason the firm exists, and how the evergreen platform took net inflows and gated no fund through an industry-wide redemption scare. · Open the full transcript →
The evergreen redemption scare, tested: net inflows in aggregate and not a single fund gated.
Erik R. Hirsch (Co-Chief Executive Officer): In this environment, the industry has seen elevated redemption requests, particularly in private credit Evergreen funds, with several evergreen funds receiving redemption requests far in excess of their caps. Against that environment, the Hamilton Lane experience has been quite different. Our Evergreen platform finished the quarter with net positive inflows in aggregate, positive quarterly performance across all funds, and not having to impose gates in any of our evergreen funds.
p. 4 · Read in context →
Why clients migrating from separate accounts into evergreens is rational for both sides: the fee-stack math.
Erik R. Hirsch (Co-Chief Executive Officer); Alex Blostein (Goldman Sachs): Relative to doing a Hamilton Lane separate account, it is still cheaper because remember, in our separate accounts, the preponderance of that capital is going into other primary funds. So we are putting a 30 to 40 basis point wrapper around a series of underlying GPs that are charging two and twenty. So that is one of the most expensive things that we have. I think the migration from client capital is totally rational. They are moving towards generally a lower fee structure that in our case is offering them the benefit of the manager-of-managers model. That is better for the customer and that is certainly better for Hamilton Lane.
p. 10 · Read in context →
Q4 & Full Year FY2025 Earnings Call — Q4 FY2025
The annual call that reset how the flagship U.S. evergreen fund earns performance fees, and laid out why private equity falls less and recovers faster than public markets and how evergreen returns compound differently from closed-end funds. · Open the full transcript →
The historical case that private equity falls less and recovers faster than public markets.
Erik Hirsch (Co-Chief Executive Officer): From early 2000 to late 2002, during the dotcom collapse, the MSCI was down close to 50% at its lowest point and took nearly four years to fully recover whereas private equity at its lowest, was down a little over 20%, but valuations recovered within two years of that point. A similar pattern emerged during the global financial crisis, where the MSCI was down nearly 50% versus 25% for private equity, but valuations recovered within two years for private equity versus four years for the MSCI. Our early assessment is that we will see a similar pattern here again. We believe private equity will fall far less, will be much less volatile and will recover faster from any downturn.
p. 2 · Read in context →
Evergreen unit economics vs closed-end: a ~2x multiple needs only ~10% annualized versus a 16% IRR.
Erik Hirsch (Co-Chief Executive Officer): To achieve the same level of multiple of invested capital, closed-end structures typically require higher IRRs compared to annualized Evergreen returns. To put numbers around this, over the course of an eight year hold period, to achieve an approximate 2 times multiple, an Evergreen structure would need to produce an annualized return of 10% versus a 16% IRR and a closed-end structure.
p. 3 · Read in context →
How early the institutional shift into evergreens is, and why fee compression hasn't shown up.
Mike Brown (Wells Fargo); Erik Hirsch (Co-Chief Executive Officer): So in terms of what inning are we in, I would say that the tail end of the National Anthem note is still sort of resonating in the stadium. So we're really early. What that looks like in terms of fee compression, totally to be determined. We're just not seeing any of that today. And again, depending on how the institution is looking at this, if they're using this as an alternative to a traditional two and 20 fund, this is already substantially cheaper than that.
p. 8 · Read in context →
Q1 FY2025 Earnings Call — Q1 FY2025
The fullest laydown of the Technology Solutions / Cobalt data business: its subscription economics and how the proprietary, direct-sourced database is monetized both directly and as the edge that wins asset-management mandates. · Open the full transcript →
What the Technology Solutions / Cobalt franchise is, and why the proprietary, direct-sourced database is the moat.
Griff Norville (Managing Director and Head of Technology Solutions): For decades, Hamilton Lane has amassed a proprietary database of private market fund and portfolio company data. Our data advantage, along with our expertise in how to use the data, is a key differentiator in attracting new clients. Cobalt is built for front office investment professionals and provides private market-specific analytics, benchmarking, portfolio construction and diligence functions.
p. 3 · Read in context →
The economics of the data business: 200+ clients, >$28M ACV, above-100% net renewal, ~30% CAGR, tied to 30% of fee-earning AUM.
Griff Norville (Managing Director and Head of Technology Solutions): Today we have over 200 clients subscribing to these services and over $28 million in annual contract value. Our average net revenue renewal rate on contracts over the last four years is above 100%. The nature of our contracts and our consistent sales efforts have made this business highly predictable and it has effectively scaled at a 30% revenue CAGR for over four years with a strong and growing pipeline. […] Over half of our Technology Solutions clients have active fee-earning AUM with the remaining set of clients representing potential for new fundraising opportunities. Technology Solutions clients are tied to over 30% of our feeearning AUM and we expect this percentage to continue to grow.
p. 4 · Read in context →
How the data is monetized: directly as a SaaS subscription, and indirectly as the tiebreaker that wins asset-management mandates.
Erik Hirsch (Co-Chief Executive Officer); Alex Bernstein (JPMorgan): So from a data standpoint, we are, I would say, directly and indirectly, as Griff alluded to, monetizing the data. So the direct is the Cobalt business, and that is really a SaaS business. So we're selling subscriptions to that. […] The indirect is what Griff alluded to, which is we're really tying it together as a way to win broader pieces of business. So the asset management tie-in again, so take secondary fund as an example – crowded space, a lot of formidable competitors out there with similar secondary offerings. And again, for us, one of those key differentiators is that selecting us gives the client preferred access to Cobalt and we use that to win a lot of ties or a lot of jump balls.
p. 5 · Read in context →
Q3 FY2024 Earnings Call — Q3 FY2024
The first call under the Hirsch-Delgado co-CEO structure, with management's framework for balance-sheet technology investments and the unit economics of the wirehouse wealth channel. · Open the full transcript →
The wirehouse economics: the full distribution cost is paid upfront, while the management fees are earned over years.
Jeff Armbrister (CFO): I'd like to remind you that the flows that come in through the wirehouse channel have an associated upfront fee from the dollars raised there. That payment is made and applied to the total amount when those dollars close into the fund. However, the corresponding management fees we earn from those same dollars come in over the course of a year for as long as the client is invested in the fund. This creates a timing mismatch between the cost of bringing those dollars on and the revenue associated with those flows. This causes our G&A to increase, with the eventual offsetting revenue to come in during the subsequent quarters and years. Simply put, we bear the full cost upfront and then receive our revenue over time.
p. 4 · Read in context →
The bull case for the wealth channel: a huge, underpenetrated market with room for many winners, not one.
Mike Brown (KBW); Erik Hirsch (Co-CEO): You have a tremendously large pool of capital, both in the U.S. and outside the U.S. that is either dramatically underexposed to this asset class or not exposed at all. If you see that trend more mirroring, if not exceeding, what institutional investors are doing, you're going to see allocation levels for retail investors well into double digits. We're nowhere near that today. Most investors today are in single digits and low single digits. The sheer amount of capital present and available is massive. You're talking about a huge market. We also don't see this as a one winner. If we compare it to public equity world, today, you have a large group of large, successful asset managers controlling billions, if not trillions, of dollars of capital. It's not a single firm or a single winner. We think that that's what this is going to look like over time for this asset class as well. Huge addressable market, massively underpenetrated, room for lots of successful product offerings.
p. 8 · Read in context →
The framework for balance-sheet technology investments: operational tools that make HL better vs distribution reach.
Mike Brown (KBW); Erik Hirsch (Co-CEO): The tech investments are across various buckets. The first bucket is technology tools that make Hamilton Lane both more efficient and a better service provider to our customers. Think about back-office reporting, data ingestion, analysis, and analytics. The vast majority of those we simply use as a client, oftentimes with preferential terms or unique strategic angles or single-purpose use cases. I'd sort of look at that bucket as Hamilton Lane being a better and higher-margin firm delivering better results more efficiently to clients due to that bucket. We've also monetized many of those over time with great success. We've had significant cash multiples. We've not only gotten the internal benefit, but we've achieved good return on our balance sheet capital. The second bucket is distribution, which is about accessing customers who we might not otherwise be able to reach or in a more beneficial way. Some of those partnerships enhance the Hamilton Lane brand in ways we see more value-added and efficient than, say, putting our logo on a baseball uniform.
p. 9 · Read in context →
More calls
Q3 FY2026 Earnings Call — Q3 FY2026 · 10 pages · Management's calendar-2025 year-in-review and the case for building momentum into a recovering exit environment. · Open →
Q2 FY2026 Earnings Call — Q2 FY2026 · 9 pages · The 'difficult but not complicated' operating philosophy and the quarter's evergreen and deal-flow trends. · Open →
Q1 FY2026 Earnings Call — Q1 FY2026 · 7 pages · The first quarter reported under the new fiscal-2026 fee-related-earnings framework, with growth across clients, assets and deal flow. · Open →
Q3 FY2025 Earnings Call — Q3 FY2025 · 9 pages · Management's fullest articulation of why culture is treated as a driver of results at the firm. · Open →
Q2 FY2025 Earnings Call — Q2 FY2025 · 8 pages · The S&P MidCap 400 index-inclusion milestone and continued evergreen momentum. · Open →
Q4 & Full Year FY2024 Earnings Call — Q4 FY2024 · 7 pages · The first full fiscal-year results under the Hirsch-Delgado co-CEO structure. · Open →
Q2 FY2024 Earnings Call — Q2 FY2024 · 6 pages · The succession announcement: Mario Giannini stepping down as CEO after 22 years and the move to co-CEOs. · Open →
Q1 FY2024 Earnings Call — Q1 FY2024 · 9 pages · The senior-leadership appointments that set up the succession, on one of the last calls with Giannini as CEO. · Open →
Hamilton Lane Incorporated's annual reports contain management's most considered account of the business. These are the sections, passages and visual pages worth opening in the originals preserved in Sources.
Hamilton Lane Incorporated — FY2026 Annual Report (Form 10-K) — FY2026
The latest 10-K: management's fullest account of a ~$1.0T private-markets platform, how it earns fees, and its evergreen and Up-C structure. · Open the full document →
Item 1. Business — Our Company — p. 10 · Read the full section →
The plain-English description of what Hamilton Lane is, does, and how big it is — the anchor for everything else.
Who they are: a global private-markets solutions provider with ~$142B AUM and ~$905B AUA.
We are a global private markets investment solutions provider dedicated to private markets investing. Since our founding in 1991, we have partnered with clients to design, implement and oversee portfolios of private markets funds and direct investments to help them access a diversified set of investment opportunities worldwide. As of March 31, 2026, we had approximately $142 billion of discretionary assets under management (“AUM”), and approximately $905 billion of nondiscretionary assets under advisement (“AUA”).
p. 10 · Read in context →
Assets Under Management and Advisement — p. 19 · Read the full section →
The franchise's scale and mix — discretionary AUM vs. advisory AUA — and where the growth is (specialized funds).
The ~$1.0T split: $142B discretionary AUM vs. $905B nondiscretionary AUA.
As of March 31, 2026, we had total AUA and AUM of approximately $1.0 trillion, of which $142 billion represents discretionary AUM from our customized separate accounts and specialized funds, and $905 billion represents nondiscretionary AUA managed on behalf of our advisory accounts.
p. 19 · Read in context →
Fees and Other Key Contractual Terms — p. 25 · Read the full section →
How the money is actually made: asset-based management fees that step down over a contract's life, plus incentive fees/carried interest.
Management fees on committed capital, invested capital or NAV — and why they decline over a mandate's life.
Fees. Generally our customized separate account clients are charged asset-based management fees annually on committed capital, net invested capital and/or net asset value (“NAV”), with the applicable fee base often transitioning over time in accordance with contractual terms. Fees frequently decrease over the life of the contract due to contractual stepdowns in fee rates and/or a reduction in applicable fee base as capital is returned to clients.
p. 25 · Read in context →
Item 1A. Risk Factors — p. 42 · Read the full section →
Two company-specific risks that could bite: redemptions from fast-growing evergreen funds, and full dependence on distributions from HLA.
Evergreen funds — now a bigger share of revenue — let investors redeem, unlike traditional drawdown funds.
Unlike traditional drawdown funds, which generally do not permit redemptions of fund interests until the liquidation of the fund upon scheduled termination dates, our evergreen funds, including our funds registered under the Investment Company Act, contain investor liquidity features that permit investors to redeem or repurchase their interests from time to time. Our evergreen funds have grown substantially in recent years and now represent a more significant portion of our AUM and our management and revenues.
p. 53 · Read in context →
Up-C structure: the public company's only material asset is its interest in HLA.
HLI is a holding company and has no material assets other than its ownership of membership units in HLA and certain deferred tax assets. As such, HLI does not have any independent means of generating revenue.
p. 84 · Read in context →
Item 7. MD&A — Revenues — p. 99 · Read the full section →
Where management explains what actually drove FY2026 results: evergreen funds powered fee growth while incentive fees fell.
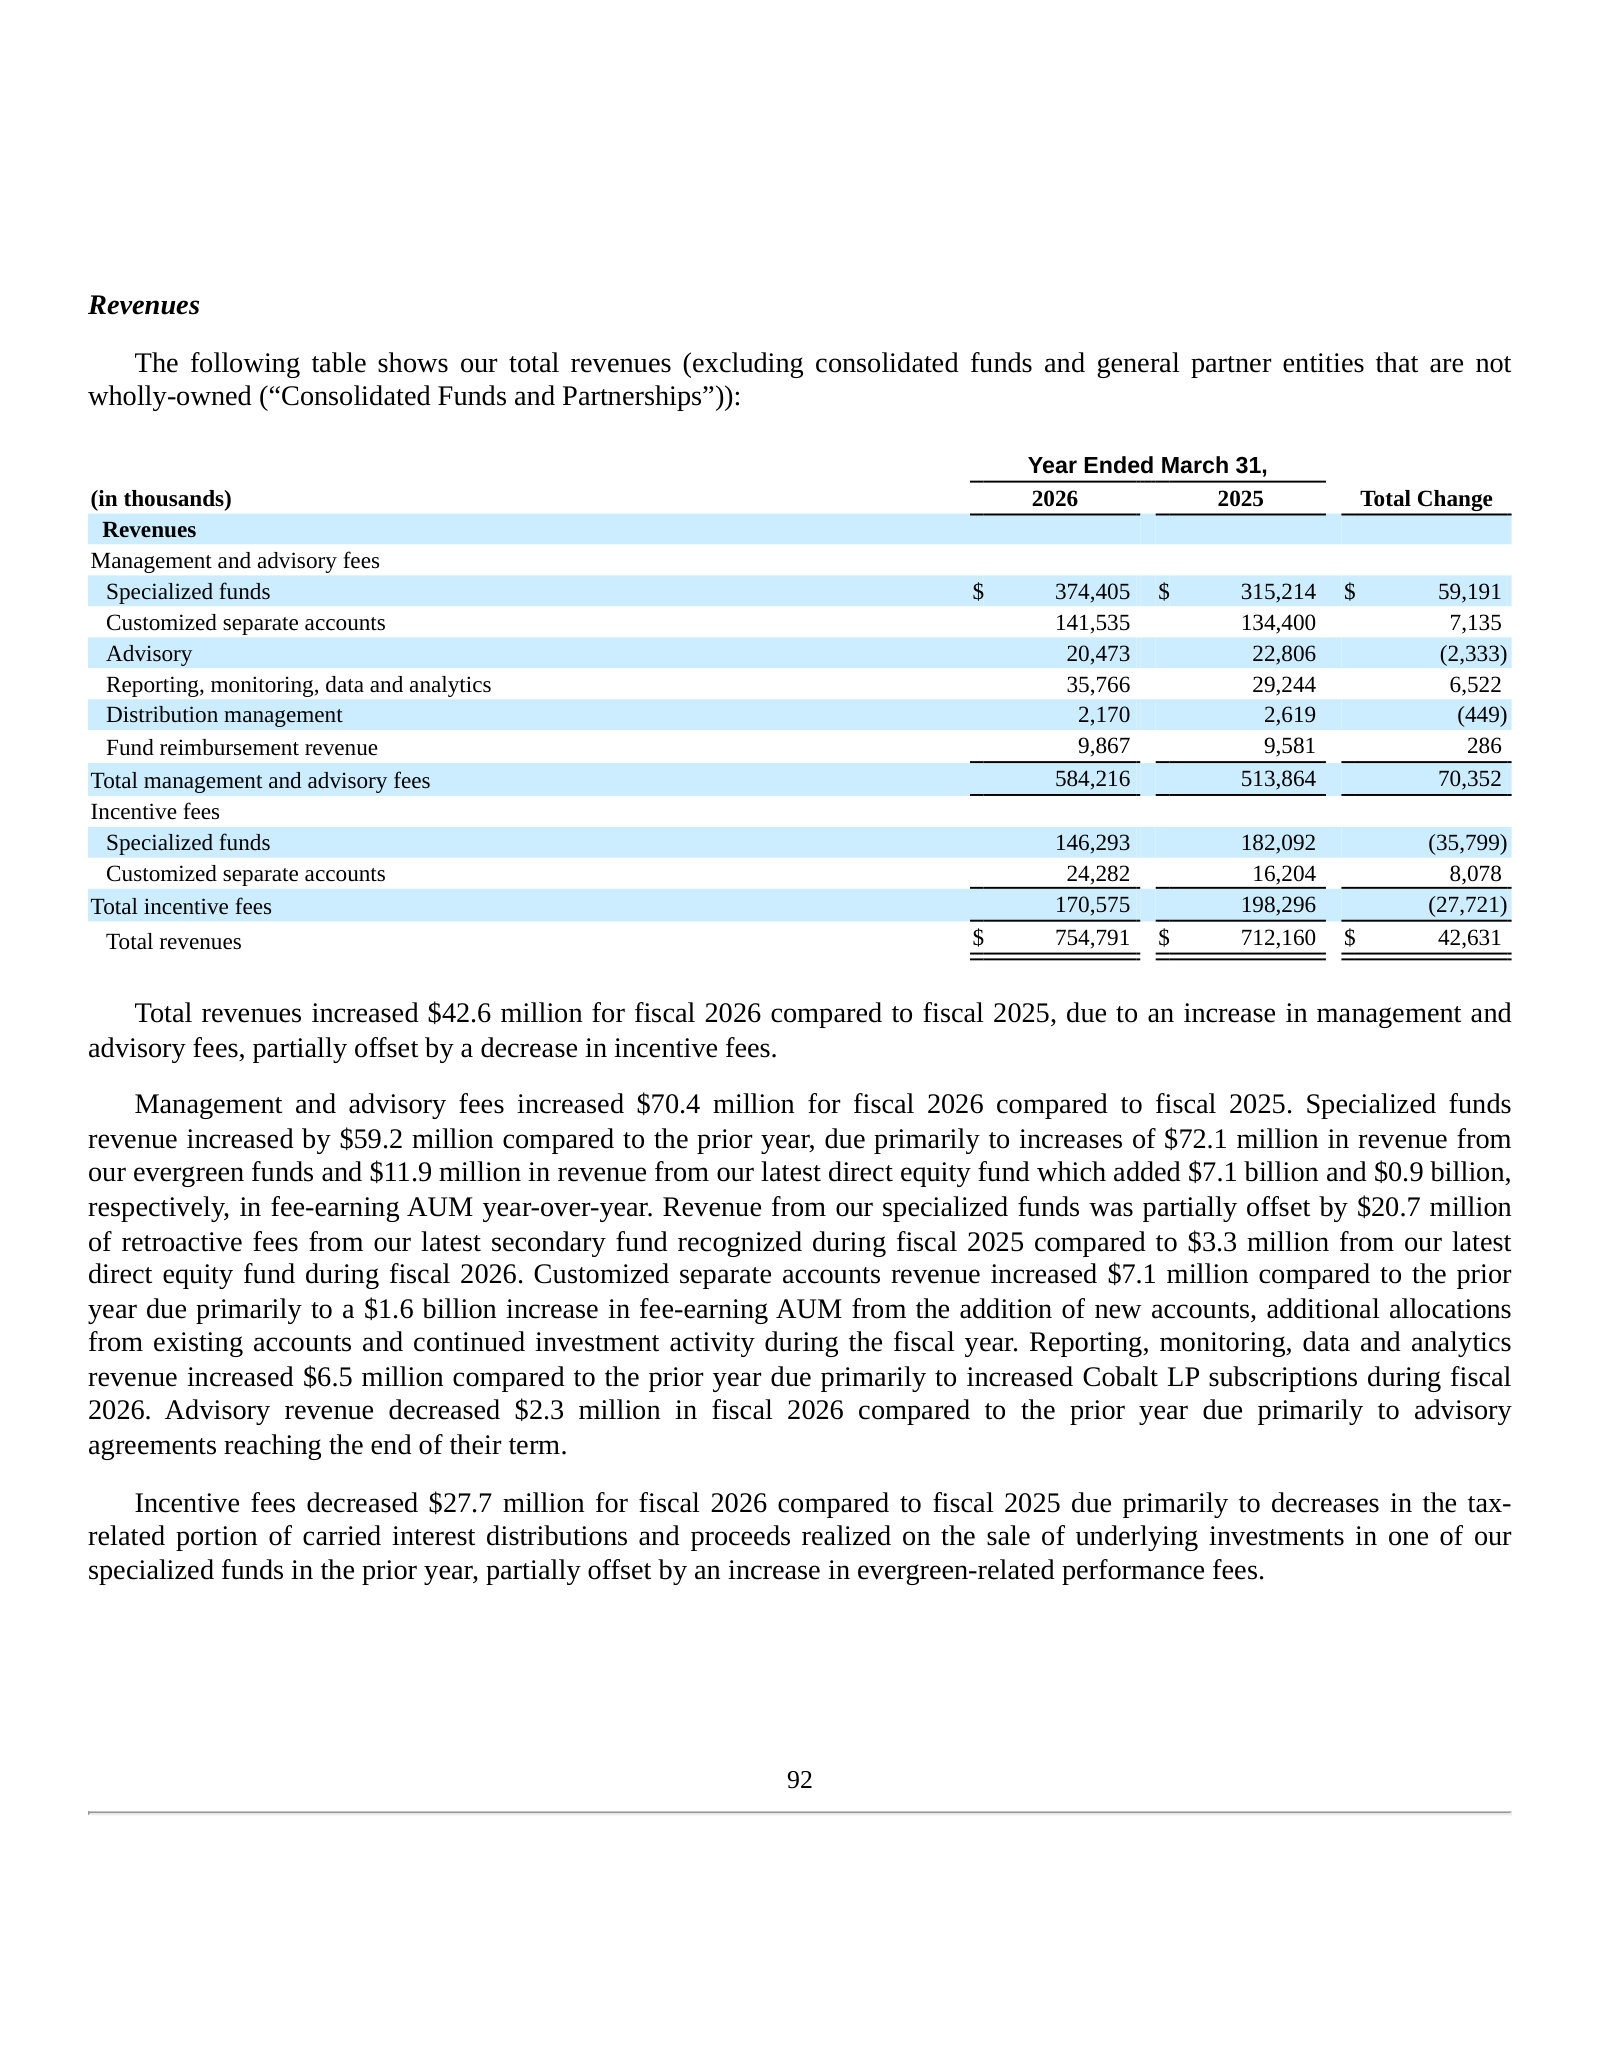
Fee growth of $70.4M led by $72.1M more from evergreen funds and new fee-earning AUM.
Total revenues increased $42.6 million for fiscal 2026 compared to fiscal 2025, due to an increase in management and advisory fees, partially offset by a decrease in incentive fees.
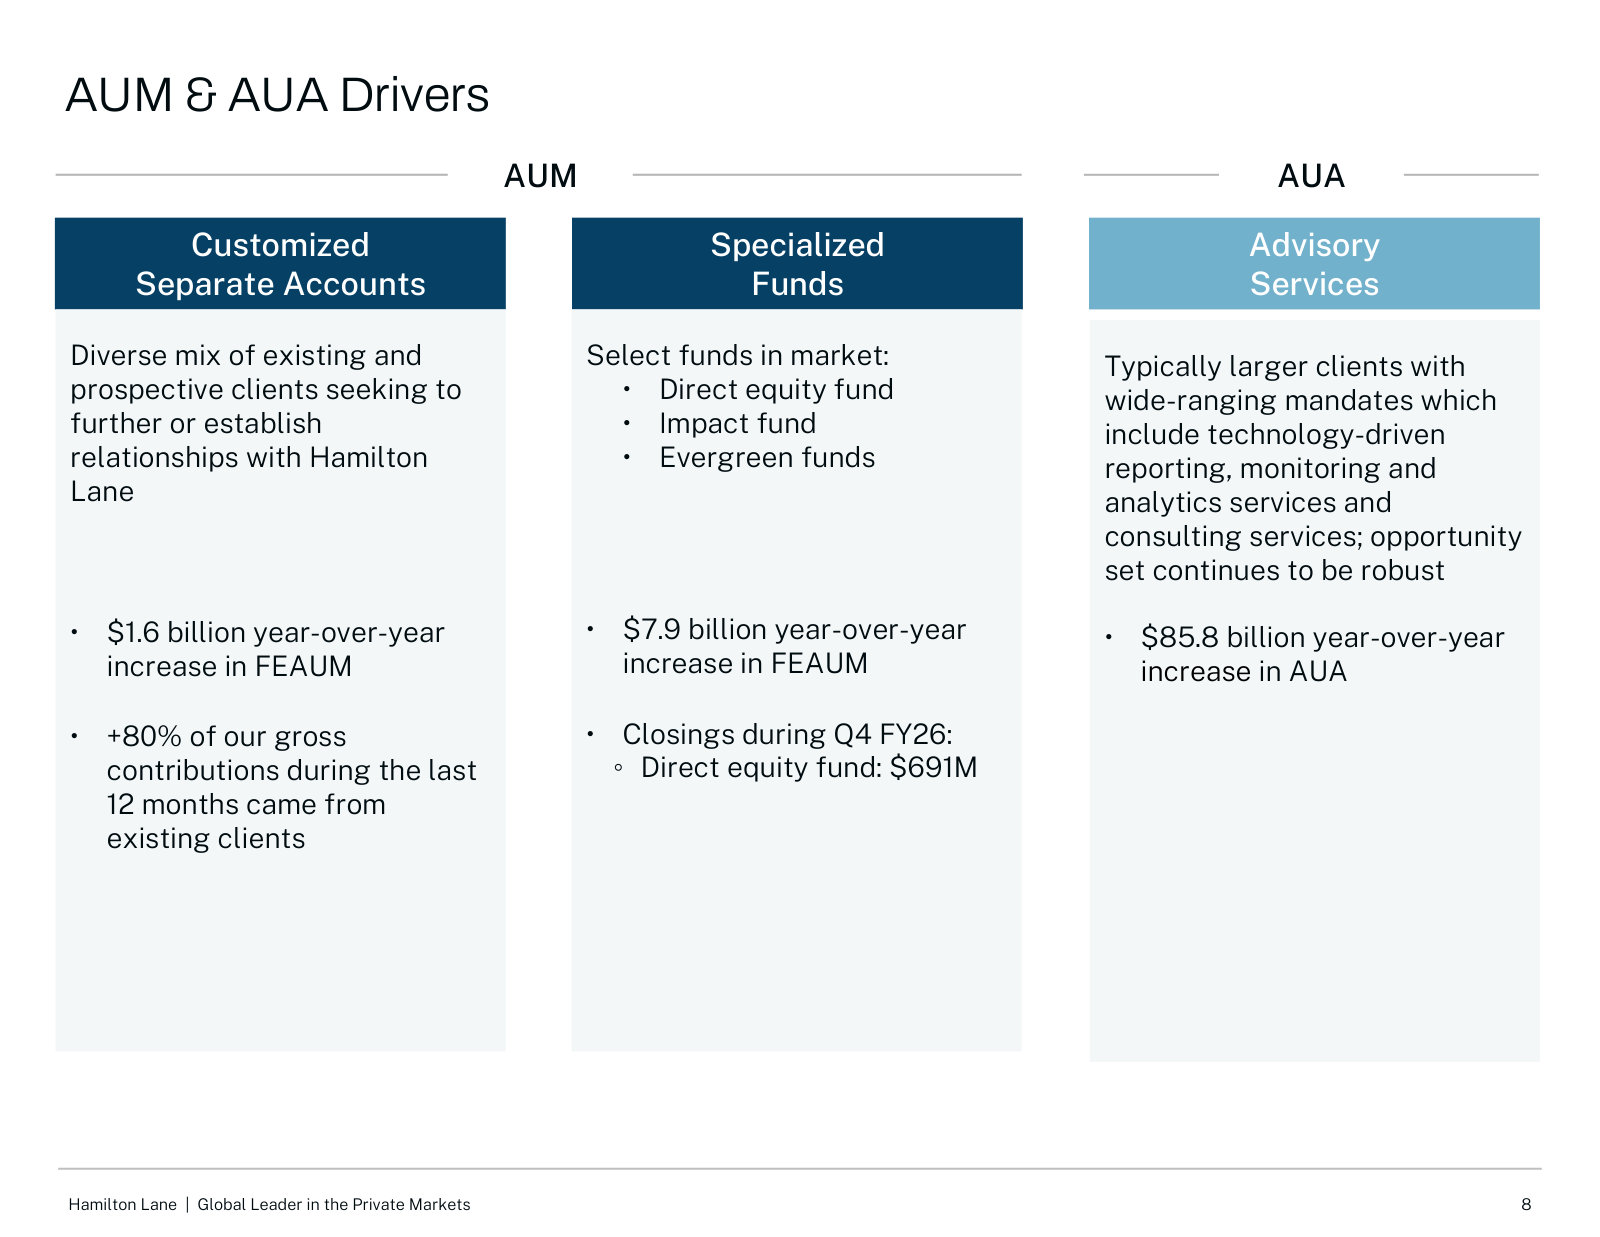
Management and advisory fees increased $70.4 million for fiscal 2026 compared to fiscal 2025. Specialized funds revenue increased by $59.2 million compared to the prior year, due primarily to increases of $72.1 million in revenue from our evergreen funds and $11.9 million in revenue from our latest direct equity fund which added $7.1 billion and $0.9 billion respectively, in fee-earning AUM year-over-year.
p. 109 · Read in context →
Non-GAAP Financial Measures — Fee Related Earnings — p. 115 · Read the full section →
The metric investors track most: FRE strips out variable incentive fees to isolate recurring fee profitability (revised Q4 FY2025).
What FRE is and what it excludes — the firm's measure of recurring earnings power.
Fee Related Earnings (“FRE”) is used to highlight earnings from revenues that are measured and received on a recurring basis. FRE represents net income excluding (a) incentive fees, net of fee related performance revenues, and related compensation, (b) equity-based compensation, (c) interest income and expense, (d) income tax expense, (e) equity in income of investees, (f) non-operating gain (loss), net and (g) certain other significant items that we believe are not indicative of our core performance.
p. 115 · Read in context →
Critical Accounting Estimates — Revenue Recognition of Incentive Fees — p. 127 · Read the full section →
Incentive fees define the upside and its variability: carried interest is recognized subject to clawback, with $1.5B still unrecognized.
$174.8M of incentive fees recognized in FY2026, against $1.5B of unrecognized carried interest.
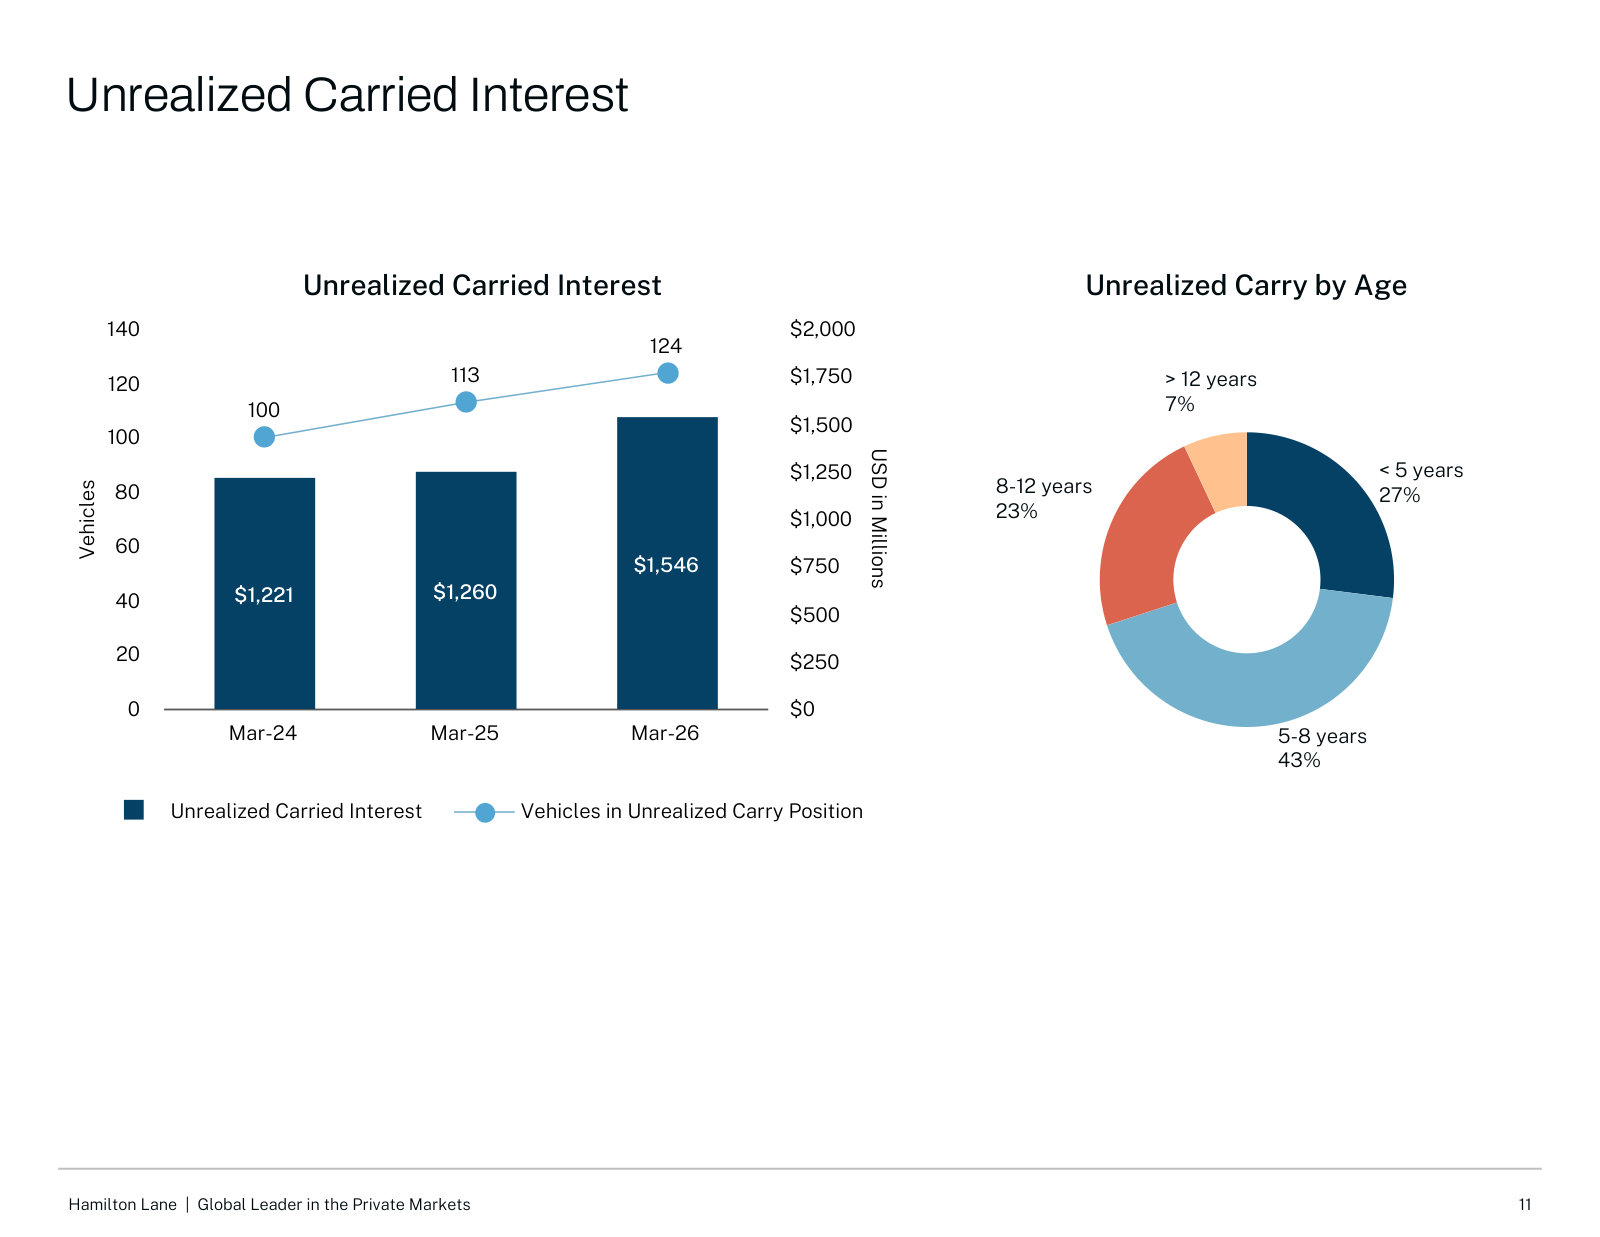
Incentive fees include both carried interest and performance fees earned from certain specialized funds and customized separate accounts. We recognized $174.8 million of incentive fees in fiscal 2026 and have $1.5 billion of unrecognized carried interest as of March 31, 2026.
p. 127 · Read in context →
More annual reports
Hamilton Lane Incorporated — FY2025 Annual Report (Form 10-K) — FY2025 · 193 pages · Prior year: introduced the revised FRE definition (excluding equity-based comp, adding FRPR) restated across periods. · Open →
Hamilton Lane Incorporated — FY2024 Annual Report (Form 10-K) — FY2024 · 192 pages · Captures the earlier build-out of the private-wealth and evergreen platform before it became the main growth driver. · Open →
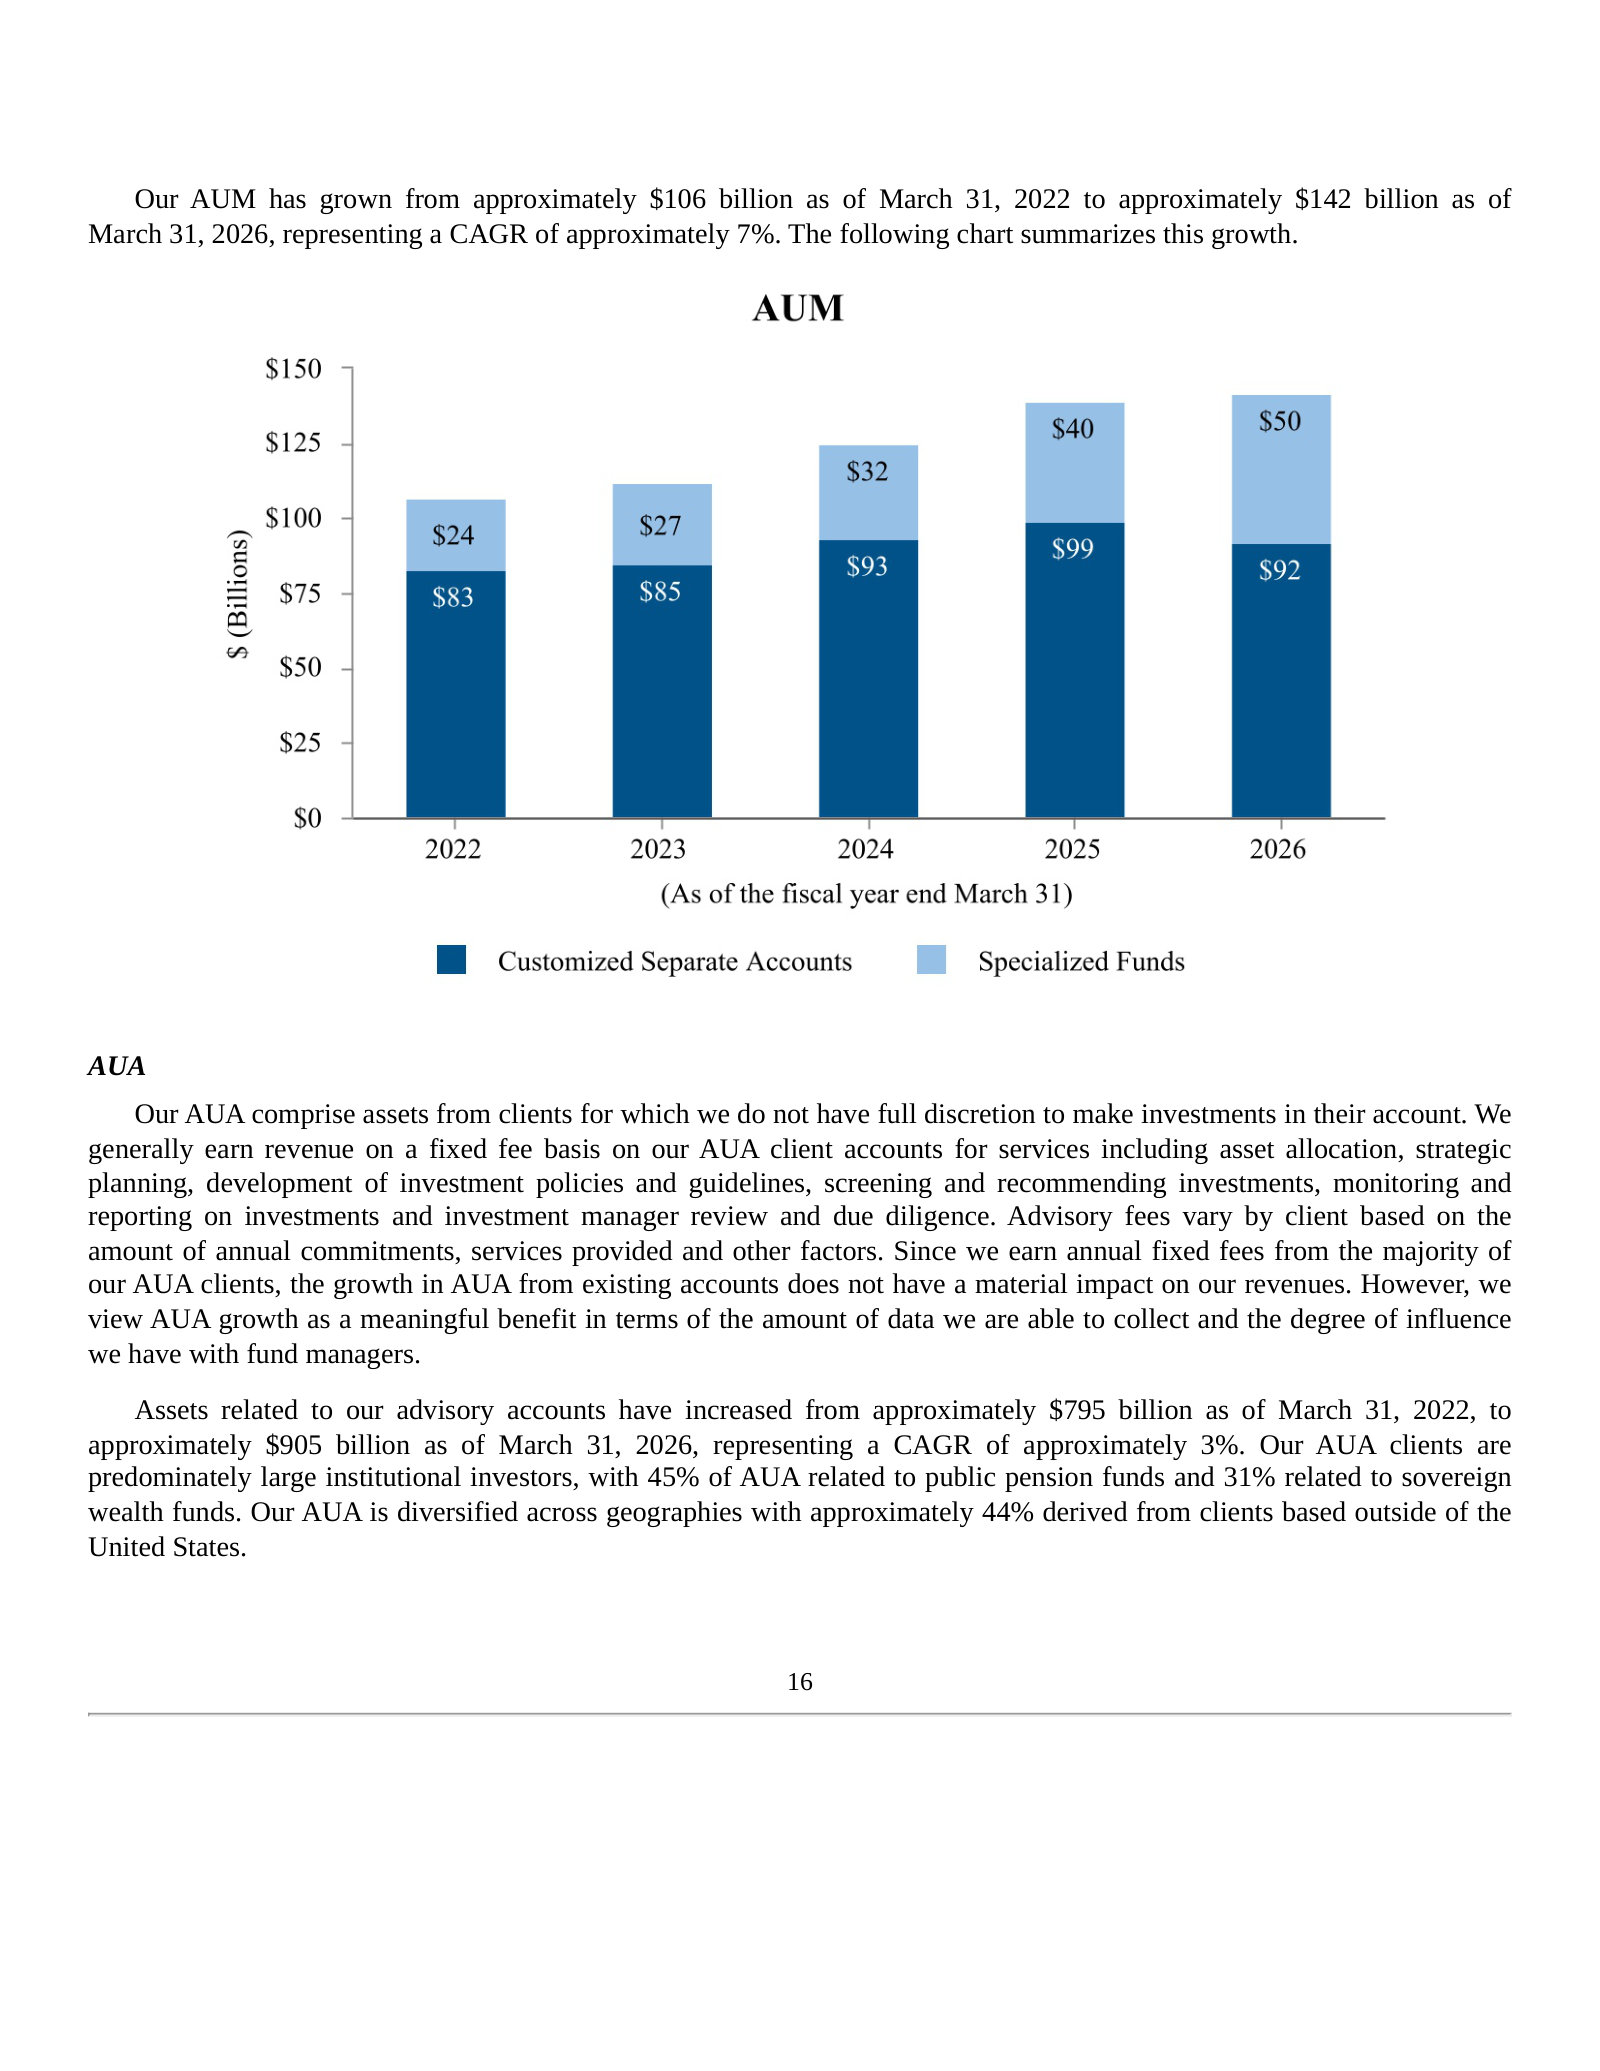
Hamilton Lane Incorporated — FY2023 Annual Report (Form 10-K) — FY2023 · 171 pages · Baseline year for the AUM-mix shift, with specialized funds at ~$27B versus $50B by FY2026. · Open →
Hamilton Lane Incorporated — FY2022 Annual Report (Form 10-K) — FY2022 · 166 pages · Earliest edition on the shelf (~$106B AUM), the starting point for the five-year growth story. · Open →
Competitors describe Hamilton Lane Incorporated's market in their own filings and calls. These verified passages and visual pages show where their strategies meet, using source documents preserved in Sources.
StepStone Group Inc. (STEP)
Private-markets solutions manager with the same core model as Hamilton Lane — separately managed accounts, commingled/specialized funds, secondaries, advisory, a fast-growing private-wealth evergreen suite and a proprietary data platform. Its closest listed analog.
StepStone's head of strategy frames a three-year industry-wide slump in distributions and fundraising, then sets StepStone's own ~$30bn-a-year fundraising against it — the firm's claim to be taking share in the same private-markets fundraising pool Hamilton Lane draws from.
Michael McCabe (Head of Strategy): While private market returns have stayed strong, distributions have been low for three consecutive years, shifting client focus from IRR to DPI. Slower exits have led to fundraising declines industry-wide, and 2025 could see another down year unless fundraising picks up in Q4. StepStone's results, however, stand out, raising nearly $30 billion annually over the last two years, a significant jump from previous years. We credit this growth to our client-focused customized approach and our data-driven insights as a major market participant.
p. 2 · Read in context →
StepStone's push into private wealth and retirement: a private-equity interval fund (STPEX) sold by ticker that drew over $700m in 30 days, and a mandate as one of five managers in an Aviva U.K. defined-contribution pension scheme — the same evergreen and wealth-channel ground Hamilton Lane is building on.
Scott Hart (CEO): We constructed STPEX to address the requests of several channel partners, leading to over $700 million in gross subscriptions in the first 30 days. This is an incredible result that frankly exceeded our own expectations. While subscriptions will moderate after this initial surge, we expect STPEX to become a significant source of private wealth inflows. […] Last month, we were thrilled to announce a partnership with Aviva to be one of five specialist managers in its U.K. trust-based pension scheme. We believe this solidifies the StepStone name as a trusted partner in private markets for retirement savings, a trend we expect to develop globally.
p. 2 · Read in context →
StepStone's private-wealth and fee-earning-AUM scoreboard — a ~$18bn evergreen platform, a record ~$40bn of undeployed fee-earning capital, and a stated 21% organic growth rate since fiscal 2021 — the growth benchmark against Hamilton Lane's own evergreen build-out.
Michael McCabe (Head of Strategy): Turning to our evergreen funds. We generated over $2.3 billion of subscriptions in our private wealth suite of offerings, growing the platform to nearly $18 billion as of the end of the quarter. […] we increased our undeployed fee-earning capital, or UFC, by $7 billion to roughly $40 billion, our highest level ever. […] The combination of fee-earning assets plus UFC grew to over $184 billion, which is up more than $12 billion sequentially and is up over $38 billion from a year ago, our strongest year of growth in our history. This translates to a 21% annual organic growth rate since fiscal 2021.
p. 3 · Read in context →
GCM Grosvenor Inc. (GCMG)
Open-architecture private-markets and absolute-return solutions provider built on customized separate accounts, specialized funds, co-investments/secondaries and advisory — increasingly targeting individual investors. A direct solutions competitor to Hamilton Lane.
GCM Grosvenor's FY2025 annual report sizes the 'democratization of alternatives' — individuals allocating under 5% to alternatives versus 20-25% for institutions, framed as a multi-trillion-dollar opportunity — and ties it to rising demand for co-investments and secondaries, the same wealth and direct-investment vectors Hamilton Lane pursues.
Individual investors, which we define as high-net-worth individuals, the mass affluent and retail investors, represent a significant growth opportunity for us and for alternative investment managers. Currently, those investors are significantly under-allocated to alternative investments compared to institutional investors. According to Bain Global’s 2023 Private Equity Report, individual investors allocate less than 5% of their total portfolios to alternatives, compared to institutional investor portfolios, such as public pension plans and sovereign wealth funds, which allocated 20-25% of their portfolios to alternatives on average. […] As education efforts increase and offerings evolve, we anticipate substantial growth in individual allocations to alternatives over the coming years — creating a multi-trillion-dollar market opportunity for the industry. […] Within investors’ alternative allocations, investors are increasingly adopting direct-oriented investments, such as co-investments and secondaries to decrease overall costs, reduce the J-curve, and enhance alpha generation.
p. 13 · Read in context →
GCM Grosvenor's president describes carrying its institutional customized-separate-account model into the wealth channel through white-label solutions (~$1bn across 11 mandates) — a direct analog to Hamilton Lane's customized-account and private-wealth strategy.
Jonathan Levin (President): We've long believed that the differentiation that's made us successful in the institutional market, serving as a customized separate account partner, would translate well in the individual investor channel. And we're seeing that thesis play out. Over the past two years, we've raised almost a billion dollars across 11 white-label solutions in the wealth channel. We believe these customized solutions will be a meaningful contributor to our growth in this channel going forward alongside everything we're doing from a product standpoint.
p. 3 · Read in context →
P10, Inc. (PX)
Multi-strategy private-markets solutions firm (private equity, venture, credit, impact) reaching institutions and the RIA/wealth channel via primaries, secondaries and co-investment — a smaller but direct solutions competitor to Hamilton Lane.
P10's CEO argues the lower- and middle-market segment it focuses on is larger and less crowded than the mega-cap sponsors — ~1,000 GPs managing ~$3trn — the small-manager end of the private markets Hamilton Lane also allocates into for clients.
Luke A. Sarsfield (Chairman and Chief Executive Officer): First, we firmly believe that our market opportunity is both larger and less competitive than the large sponsor market segment, and the data we've provided in our earnings presentation clearly supports this assertion. […] One, our opportunity set has approximately 1,000 GPs managing approximately $3 trillion, more than 5x the number of GPs at the upper end of the market. Two, if you drill down into the opportunity set for the smaller managers, those in the middle and lower middle market have more than 10x the number of companies on which to focus relative to managers in the larger part of the market.
p. 2 · Read in context →
P10's fundraising and secondaries scorecard — $4.3bn raised and deployed year-to-date (+48%), a secondaries fund (RCP Secondary Fund V) closing at $1.26bn in 13 months, and wealth managers crossing into that fund for the first time — overlapping Hamilton Lane's secondaries and private-wealth franchises.
Luke A. Sarsfield (Chairman and Chief Executive Officer): In the first three quarters of 2025, we raised and deployed $4.3 billion of organic fee-paying assets under management, an increase of 48% when compared to the capital raised in the same period of 2024. […] During the quarter, we had 17 commingled funds in the market. RCP's Secondary Fund V closed at $1.26 billion, exceeding our target of $1 billion. We've seen strong demand for our secondaries products, and this fund was no exception. We closed Secondary Fund V in 13 months. The predecessor, Secondary Fund IV was $797 million and took 25 months to close. […] We recently saw several wealth managers who were invested across our private credit and venture capital strategies commit to RCP's latest secondaries fund for the first time.
p. 2 · Read in context →
Blackstone Inc. (BX)
The largest alternative-asset manager. Not a solutions firm, but the market-defining competitor in two arenas Hamilton Lane is growing into: private-wealth perpetual/semi-liquid vehicles for individuals, and secondaries (Strategic Partners).
Blackstone's stated scale in private wealth — a ~$290bn platform it says holds an estimated 50% share of private-wealth revenue among nine major alternative firms (citing Goldman Sachs research) — the dominant incumbent in the individual-investor channel Hamilton Lane is entering.
Jonathan Gray (President and COO): Turning to private wealth, where our platform has grown to nearly $290 billion, as I mentioned, up threefold in the past 5 years. To put our scale in perspective, a recent Goldman Sachs research report highlighted that Blackstone has an estimated 50% share of all private wealth revenue among 9 major alternative firms. To put our momentum in perspective, we raised over $11 billion in the channel in the third quarter, more than double year-over-year, to the highest level in over 3 years. […] BXP raised $2.1 billion in the third quarter, bringing its NAV to $15 billion in only 7 quarters.
p. 3 · Read in context →
Blackstone's own sizing of the private-wealth opportunity — a '$140 trillion' channel in which it calls itself 'by far the largest private wealth alternative platform in the world,' with perpetual-vehicle revenue topping $700m in the quarter — the market-leader's view of the channel Hamilton Lane competes for.
Jonathan D. Gray (President and COO): In this vast channel, $140 trillion, including mass affluent and high-net-worth individuals, a new generation of investors is gaining access to the benefits of alternatives, which is a development led by Blackstone. We started raising private wealth capital 23 years ago and established a dedicated organization nearly 15 years ago, growing AUM to almost $280 billion today, by far the largest private wealth alternative platform in the world. […] Revenue from these vehicles exceeded $700 million in the second quarter alone compared to approximately $50 million in the same quarter 5 years ago.
p. 3 · Read in context →
Blackstone sizes its Strategic Partners secondaries business at $91bn (doubled in five years) with a new private-equity secondaries flagship targeting $22bn-plus — the scale of the secondaries market in which Hamilton Lane's specialized funds compete.
Jonathan D. Gray (President and COO): In our $91 billion secondaries business, which has doubled in the last 5 years, we raised additional capital for our fourth infrastructure vehicle, bringing it to over $5 billion, nearly 40% larger than the prior vintage. And we launched fundraising for our new PE secondaries flagship, targeting at least the size of the prior $22 billion fund with the first close expected in the fourth quarter.
p. 4 · Read in context →
Ares Management Corporation (ARES)
Credit-led alternative manager that collides with Hamilton Lane in the private-wealth channel (semi-liquid/perpetual products), secondaries (Ares Secondaries, ex-Landmark), infrastructure and private credit.
Ares claims a top-five position and ~10% share of the wealth channel, with $50bn across eight semi-liquid products and $167bn of perpetual capital (about half its fee-paying AUM) — quantifying a wealth-distribution platform that competes with Hamilton Lane's evergreen funds.
Michael J. Arougheti (CEO): In the wealth channel, we continue to benefit from our top 5 leadership position with an estimated market share approaching 10%. Our momentum remains strong with our fundraising for the first half of the year totaling $7 billion in equity commitments, a 54% increase over the first half of 2024. AUM across our eight semi liquid products crossed $50 billion […] Our perpetual capital AUM now stands at $167 billion and represents nearly half of our total fee-paying AUM.
p. 2 · Read in context →
Ares' FY2025 10-K sizes its multi-asset Secondaries Group at $42.1bn across private equity, real estate, infrastructure and credit — the diversified secondaries footprint that overlaps Hamilton Lane's secondaries strategy.
Our Secondaries Group invests in secondary markets primarily in North America and across a range of alternative asset class strategies, including private equity, real estate, infrastructure and credit. As of December 31, 2025, our team manages $42.1 billion of AUM in over 90 funds. […] our private equity secondaries team of more than 40 investment professionals managed $22.1 billion of AUM in over 40 funds and related co-investment vehicles.
p. 23 · Read in context →
The Carlyle Group Inc. (CG)
Global alternative manager whose AlpInvest arm — secondaries, primary fund investments, co-investment and portfolio finance — is the closest structural analog among the mega-GPs to Hamilton Lane's specialized funds and customized accounts; also a private-wealth competitor.
Carlyle's CEO frames AlpInvest as one of only a few secondaries 'hyperscalers,' spanning secondaries, co-investments, primary fund investments and portfolio finance — a description of a full private-markets solutions platform that maps closely onto Hamilton Lane's own multi-strategy model.
Harvey Mitchell Schwartz (CEO): As John pointed out, there are only a few hyperscalers in this business, and we are one of them. Being a hyperscaler means having 25 years of experience, and we celebrated our 25th anniversary of AlpInvest in Amsterdam this year. […] It’s often simplified to just secondaries, but it encompasses secondaries, co-investments, primary offerings on our platform, and portfolio finance. This is where we find our unique advantage. Our business is evolving into one that offers corporate finance solutions, not just secondaries.
p. 9 · Read in context →
Carlyle reports AlpInvest fee-related earnings up more than 80% year-to-date, a record $20bn secondaries fund, and evergreen wealth inflows running ~10x higher at $3bn a quarter — the secondaries-plus-wealth engine that competes with Hamilton Lane.
Harvey Schwartz (CEO): In Carlyle AlpInvest, the team continues to deliver exceptional growth with FRE more than 80% year-to-date. Last month, we closed our largest-ever secondaries fund of $20 billion, further scaling the business. […] we were attracting about $300 million per quarter in evergreen wealth inflows. Today, we're running at 10x that level at $3 billion of inflows, our best fundraising quarter in Global Wealth ever.
p. 1 · Read in context →
More peer documents
StepStone — Q4 FY2025 earnings call — Q4 FY2025 · 10 pages · Private-wealth build-out year over year ($3.4bn→$8bn AUM, ~300→~500 distribution platforms) and the full evergreen lineup (S Prime, CredX, Instruqt) sold by ticker. · Open →
StepStone — FY2025 annual report (10-K) — FY2025 · 206 pages · Filing-based view: the explicit 'Competition' section (p.23) and secondaries mechanics (p.16) for StepStone's own description of the solutions business. · Open →
GCM Grosvenor — Q1 FY2026 earnings call — Q1 FY2026 · 8 pages · Levin's open-architecture, multi-wrapper wealth strategy (separate accounts, 3(c)(7), registered funds) and a ~$500m single-quarter wealth-channel raise. · Open →
Blackstone — FY2025 annual report (10-K) — FY2025 · 285 pages · Filing-based descriptions of the 'Private Wealth Strategy,' perpetual-capital vehicles (BREIT/BCRED/BXPE/BXINFRA) and Strategic Partners secondaries (pp.9, 11). · Open →
Ares Management — Q3 FY2025 earnings call — Q3 FY2025 · 12 pages · Ares raises its 2028 semi-liquid wealth AUM target from $100bn to $125bn, claims #2 industry fundraising share and calls the wealth shift 'early innings.' · Open →
Carlyle — Q1 FY2026 earnings call — Q1 FY2026 · 9 pages · AlpInvest scorecard: record $107bn AUM (+20%), $6.8bn quarterly inflows and $19bn of evergreen wealth AUM (4x in three years). · Open →
Source: S&P Capital IQ consensus via Xpressfeed · Generated 2026-07-25.
Hamilton Lane's consensus tape shows a near-term upgrade cycle: FY2027 revenue and normalized EPS have both been raised over the past quarter, even as FY2028 estimates were trimmed. The company has beaten normalized-EPS consensus six quarters running, several times by more than 30%, though its most recent quarter saw revenue fall just short. Forward growth stays strong, with revenue compounding in the high teens, but coverage thins sharply beyond FY2028. All figures are in USD.
FY2027 estimates raised ~3-4% in 90 days while FY2028 is trimmed ~3%
The bifurcation is modest but directional: strength is being pulled into FY2027 rather than added to FY2028.
Currency: USD · Scale: money in millions, absolute · Point-in-time consensus; Δ90d is Now versus 90d.
| Metric | FY | 180d | 90d | 30d | Now | Δ90d |
|---|---|---|---|---|---|---|
| EPS (normalized) | FY2027 | $6.28 | $6.01 | $6.10 | $6.26 | +4.3% |
| EPS (normalized) | FY2028 | $7.61 | $7.44 | $7.40 | $7.36 | -1.0% |
| Revenue | FY2027 | $909.65m | $878.44m | $886.39m | $904.23m | +2.9% |
| Revenue | FY2028 | $1.08bn | $1.06bn | $1.05bn | $1.05bn | -0.4% |
Beat / miss record
The scale and persistence of the EPS surprises is consistent with conservative guidance; the FY2026 Q4 revenue miss is the first crack in an otherwise strong top-line record.
Current sequences by metric: Revenue: 1 consecutive miss; EPS (normalized): 6 consecutive beats.
Currency: USD · Scale: money in millions, absolute · Consensus is captured before each actual first became effective.
| Quarter | Metric | Consensus | Actual | Surprise | Outcome |
|---|---|---|---|---|---|
| Q4 FY2026 | Revenue | $203.05m | $193.57m | -4.7% | Miss |
| Q4 FY2026 | EPS (normalized) | $1.43 | $1.49 | +4.5% | Beat |
| Q3 FY2026 | Revenue | $195.52m | $198.59m | +1.6% | Beat |
| Q3 FY2026 | EPS (normalized) | $1.33 | $1.55 | +16.9% | Beat |
| Q2 FY2026 | Revenue | $169.44m | $190.88m | +12.7% | Beat |
| Q2 FY2026 | EPS (normalized) | $1.10 | $1.54 | +39.8% | Beat |
| Q1 FY2026 | Revenue | $162.38m | $175.96m | +8.4% | Beat |
| Q1 FY2026 | EPS (normalized) | $0.99 | $1.31 | +32.6% | Beat |
| Q4 FY2025 | Revenue | $170.69m | $197.97m | +16.0% | Beat |
| Q4 FY2025 | EPS (normalized) | $1.17 | $1.21 | +3.1% | Beat |
| Q3 FY2025 | Revenue | $157.95m | $168.26m | +6.5% | Beat |
| Q3 FY2025 | EPS (normalized) | $1.10 | $1.25 | +13.7% | Beat |
| Q2 FY2025 | Revenue | $154.17m | $150.00m | -2.7% | Miss |
| Q2 FY2025 | EPS (normalized) | $1.09 | $1.07 | -1.7% | Miss |
| Q1 FY2025 | Revenue | $152.52m | $196.73m | +29.0% | Beat |
| Q1 FY2025 | EPS (normalized) | $1.13 | $1.51 | +33.9% | Beat |
Revenue compounds in the high teens then decelerates; EPS growth reaccelerates in FY2028
FY2029 rests on just two analysts, so read the outer year as indicative rather than settled.
Currency: USD · Scale: money in millions, absolute · YoY uses the prior fiscal year from the feed; analyst count and range use the first displayed period.
| Metric | FY2026A | FY2027E | FY2028E | FY2029E | YoY | Analysts | Low / high |
|---|---|---|---|---|---|---|---|
| Revenue | $767.03m | $904.23m | $1.05bn | $1.15bn | +7.6% | 5 | $760.59m / $771.41m |
| EPS (normalized) | $5.74 | $6.26 | $7.36 | $8.24 | +13.9% | 6 | $5.35 / $5.85 |
Analysts span $5.30-$6.61 on FY2027 EPS, a ~21% spread across 7 estimates
FY2028 revenue is similarly unsettled, ranging from roughly $989M to $1.11B across five analysts.
Currency: USD · Scale: money in millions, absolute · Spread/mean is absolute high-low divided by absolute mean.
| Metric | Period | Mean | Low–high | Spread/mean | Analysts |
|---|---|---|---|---|---|
| EPS (normalized) | FY2027E | $6.26 | $5.30–$6.61 | 20.9% | 7 |
| Revenue | FY2028E | $1.05bn | $988.50m–$1.11bn | 11.5% | 5 |
Street snapshot
Currency: USD · Scale: money in millions, absolute · Analyst counts shown explicitly.
| Street view | Reading | Analysts |
|---|---|---|
| Recommendation mix | Buy 4, Outperform 2, Hold 1, Underperform 0, Sell 0 | 7 |
| Consensus score | 1.57 | 7 |
| Target price | mean $126.9; median $123.0; high $174.0; low $94.00 | 7 |
Visible Alpha broker models via S&P Xpressfeed · 6 brokers · 287 line items · freshest revision 2026-07-21.
The street models Hamilton Lane as a private-markets compounder: fee-earning AUM rising to roughly $97bn by FY-2028, with nearly all the growth in higher-fee specialized funds while customized separate accounts stay flat. Management and advisory fees and the fee-earning base are tightly modeled; the genuine disagreement sits in out-year incentive and performance fees, where carry-realization timing splits the six brokers. Fee-related earnings per unit compound to about $7.8 by FY-2028. This tab reads the segment detail behind that path; the CapIQ tab carries headline revenue and EPS consensus.
Specialized funds are the modeled growth engine; separate accounts sit flat
Specialized funds carry a ~1.05% fee versus ~0.34% on separate accounts, so the mix shift compounds revenue faster than AUM. Specialized-fund FEAUM overtakes separate accounts in FY-2027 and grows a further +16% in FY-2028.
| Line | FY-2025A | FY-2026A | FY-2027E | FY-2028E | YoY | Brokers |
|---|---|---|---|---|---|---|
| FEAUM | — | — | — | — | — | — |
| Total fee earning assets under management | $72.87bn | $80.74bn | $88.87bn | $98.27bn | +10.1% | 6 |
| Total FEAUM - specialized funds | $32.26bn | $39.32bn | $46.50bn | $54.06bn | +18.3% | 6 |
| Total FEAUM - customized separate accounts | $40.61bn | $41.42bn | $42.38bn | $44.21bn | +2.3% | 6 |
| Fee rate | — | — | — | — | — | — |
| Specialized funds fee rate(%) | 1.0% | 1.0% | 1.0% | 1.1% | +0.0pt | 6 |
| Separate accounts fee rate(%) | 0.4% | 0.4% | 0.3% | 0.3% | -0.0pt | 6 |
The mix shift lands in fee revenue and fee-related earnings
| Line | FY-2025A | FY-2026A | FY-2027E | FY-2028E | YoY | Brokers |
|---|---|---|---|---|---|---|
| Fee revenue | — | — | — | — | — | — |
| Management and advisory fees | $515.60m | $583.67m | $671.87m | $769.88m | +15.1% | 6 |
| Specialized funds | $314.20m | $372.00m | $455.09m | $542.47m | +22.3% | 6 |
| Customized separate accounts | $136.87m | $142.43m | $143.93m | $148.31m | +1.1% | 6 |
| Earnings | — | — | — | — | — | — |
| Fee-related earnings | $220.37m | $339.46m | $386.62m | $439.05m | +13.9% | 6 |
| Fee-related earnings per unit($) | $4.06 | $6.23 | $7.10 | $8.03 | +14.0% | 6 |
| Distributable earnings per share($) | $4.97 | $6.07 | $6.33 | $7.25 | +4.2% | 6 |
Brokers agree on the fee base; they split on out-year performance fees
| Line | Period | Median | Q1–Q3 | Min–max | Brokers |
|---|---|---|---|---|---|
| Incentive fees | FY-2028E | $268.10m | $242.18m–$294.31m | $218.00m–$305.18m | 6 |
| Fee related performance revenue (FRPR) | FY-2028E | $121.96m | $112.52m–$135.91m | $97.13m–$146.75m | 6 |
| Realized incentive revenue | FY-2028E | $190.98m | $181.93m–$206.89m | $174.13m–$219.32m | 6 |
Core lines are fresh and well-covered; some detail rests on few brokers
Core FEAUM, fee and earnings lines carry five to six brokers and were refreshed on 2026-07-21. Total AUM and assets-under-advisement rest on only three to four brokers, and after-tax fee-related earnings is a single-broker view; treat the FY-2028 outer year, where dispersion widens, as a forecast rather than settled consensus.
Headline P&L consensus, momentum and beat/miss live in the CapIQ tab.
Source: S&P Capital IQ transcripts via Xpressfeed · latest indexed call 2026-05-21 · generated 2026-07-25.
Latest call digest
Hamilton Lane Incorporated, Q4 2026 Earnings Call, May 21, 2026 · 2026-05-21T15:00:00
Q4 FY2026 (reported May 21, 2026). Prepared remarks were confident: the total asset footprint reached $1 trillion, FY2026 management and advisory fees rose 14%, fee-related earnings margin was 50%, and the board lifted the dividend 11% to $2.40. Erik Hirsch devoted unusual length to defending secondary-market valuation practice and private-credit health against the prevailing "credit crisis" narrative. The Evergreen suite finished the quarter with over $1 billion of net inflows and AUM above $17.5 billion (64% growth year-over-year), with no fund gated.
The Q&A surfaced the softer reality behind the headline. Management disclosed that flows decelerated within the quarter — January +$471 million, February +$591 million, then March -$17 million — with April expected at just over $265 million, well below the January/February pace. Erik said he would be "very disappointed" if April became the new run-rate. Analysts pressed hardest on Evergreen redemption/liquidity handling, the "day 1" mark used for secondary incentive fees, and the pace of wealth distribution. The guidance actually committed to was modest: the ~$265 million April flow expectation, a first close for the new GP-led secondary fund before calendar 2026 year-end, and continued dividend growth.
Participant coverage from the latest call.
| Group | Participants | Count |
|---|---|---|
| Management | Operator; John Oh — MD & Head of Shareholder Relations, Hamilton Lane Incorporated; Erik Hirsch — Co-CEO & Member of the Board, Hamilton Lane Incorporated; Jeffrey Armbrister — Chief Financial Officer, Hamilton Lane Incorporated | 4 |
| Analysts | Kenneth Worthington — Managing Director, JPMorgan Chase & Co, Research Division; Alexander Blostein — Lead Capital Markets Analyst, Goldman Sachs Group, Inc., Research Division; Michael Cyprys — Executive Director and Senior Research Analyst, Morgan Stanley, Research Division; Michael Brown — Managing Director, UBS Investment Bank, Research Division; Unknown Analyst; Alexander Bond — Research Analyst, Keefe, Bruyette, & Woods, Inc., Research Division | 6 |
Curated latest-call exchanges; one row per analyst topic.
| Analyst | Firm | Topic | What changed in Q&A |
|---|---|---|---|
| Kenneth Worthington | JPMorgan | Wealth distribution and wirehouse pipeline | Asked how the pipeline looks for getting more funds onto wirehouses and about wealth-sales hiring; management said it does not control placement, that several products are nearing $1B critical mass, and that recent senior hires are not yet contributing. |
| Alexander Blostein | Goldman Sachs | April flows and Evergreen fee structure | Sought product-level flow detail and whether growing institutional Evergreen use could pressure fees; management said redemptions were concentrated in credit and international multi-strat and framed Evergreen as cheaper than closed-end or SMA alternatives. |
| Michael Cyprys | Morgan Stanley | Evergreen NAV mix and liquidity management | Pressed on institutional versus wire/RIA composition and how liquidity would be managed if redemptions exceeded the cap for an extended period; management pointed to cash reserves, lines of credit and diversification without a scenario-specific answer. |
| Michael Brown | UBS | Secondaries selectivity and incentive-fee marking | Questioned why roughly 99% of deal flow is declined and the rationale for the day-1 NAV mark in incentive fees; management cited asset and manager quality screening and industry-standard GAAP treatment. |
| Alexander Bond | KBW | April flow run-rate and exit outlook | Asked whether the softer April flow is a reasonable run-rate and about the magnitude of a second-half exit pickup; management pushed back on April as a reference point and tied improving exits to asset aging and buyer/seller equilibrium. |
| Unknown Analyst (for Brennan Hawken) | BMO Capital Markets | Park Avenue Securities and Cobalt bundling | Asked about the Guardian-affiliated Park Avenue Securities contribution and the drivers of reporting and monitoring fee growth; management said it is early days and pointed to Cobalt bundling and standalone subscription growth. |
Theme tracker
Themes are curator-classified across supplied calls.
| Theme | Status | Quarters mentioned | Read-through |
|---|---|---|---|
| Evergreen/semi-liquid platform as primary growth engine | persisted | Q1 2024, Q2 2024, Q3 2024, Q4 2024, Q1 2025, Q2 2025, Q3 2025, Q4 2025, Q1 2026, Q2 2026, Q3 2026, Q4 2026 | Discussed on every call and consistently cited as the main driver of fee-earning AUM and the rising blended fee rate; AUM scaled from roughly $4.2 billion (Q1 2024) to over $17.5 billion (Q4 2026) and the fund count grew from 3 to 12. |
| Wealth and wirehouse distribution build-out | persisted | Q1 2024, Q2 2024, Q3 2024, Q4 2024, Q1 2025, Q2 2025, Q3 2025, Q4 2025, Q1 2026, Q2 2026, Q3 2026, Q4 2026 | A recurring focus since the first two wirehouse onboardings; management repeatedly notes that only PAF sits on U.S. wires, with other products sold directly into RIA and wealth platforms. |
| Secondaries franchise expansion | persisted | Q1 2024, Q2 2024, Q3 2024, Q4 2024, Q1 2025, Q2 2025, Q3 2025, Q4 2025, Q1 2026, Q2 2026, Q3 2026, Q4 2026 | Continuous thread from Fund VI's final close ($5.6 billion) through the Fund VII launch, a second venture product and the first GP-led secondary fund; the latest call gave secondaries valuation an extended defense. |
| Technology and tokenization balance-sheet investments | persisted | Q1 2024, Q2 2024, Q3 2024, Q4 2024, Q1 2025, Q2 2025, Q3 2025, Q4 2025, Q1 2026, Q2 2026, Q3 2026, Q4 2026 | Nearly every call announces a new innovations/technology stake (TIFIN, Libre, IDR, Daphne, Securitize, Northern Trust, 73 Strings, Republic, Bloomberg, Novata, Pluto, Corastone), framed as brand, distribution and efficiency enablers. |
| Institutional adoption of Evergreen vehicles | emerged | Q3 2025, Q4 2025, Q1 2026, Q2 2026, Q3 2026, Q4 2026 | Became an explicit, quantified talking point from Q4 2025 (about 15% of capital / roughly 150 institutions), rising toward 25% of Evergreen flows by Q4 2026; framed as portfolio-construction and small-institution re-entry rather than pure retail demand. |
| Defense of private-credit health against a 'crisis' narrative | emerged | Q2 2026, Q3 2026, Q4 2026 | New in the last three calls; management pre-emptively rebuts credit-crisis and AI-software-risk narratives with low-default and dispersion data, a defensive posture absent from earlier calls that treated credit mainly as a growth opportunity. |
| Exit and distribution environment | persisted | Q1 2024, Q3 2024, Q4 2025, Q1 2026, Q3 2026, Q4 2026 | A recurring topic that shifted tone from 'muted exits / extended hold periods' (FY2024-FY2025) to buyer/seller equilibrium and improving activity by FY2026, with hold periods cited at around five years. |
| FRE margin mechanics and equity-based compensation scrutiny | dropped | Q1 2024, Q2 2024, Q3 2024, Q4 2024, Q2 2025, Q3 2025, Q4 2025 | Margin, wirehouse commission drag and the $30 million equity-comp step-up dominated Q&A through fiscal 2024-2025 but were essentially absent from the last four calls, where flows, secondaries and credit took over. |
Guidance ledger
Quotes, calls, and speakers are source-verified; outcomes are curator-classified.
| Verbatim guidance | Call | Speaker | Curator outcome | Outcome note |
|---|---|---|---|---|
| “we expect to take in over $265 million in aggregate net inflows across the entire group of products” | Hamilton Lane Incorporated, Q4 2026 Earnings Call, May 21, 2026 · 2026-05-21T15:00:00 | Erik Hirsch | unknown | Stated on the most recent call about April activity; no subsequent quarter is available to confirm the figure. |
| “we expect to receive additional annual commitments of approximately $500 million for at least 10 years” | Hamilton Lane Incorporated, Q3 2026 Earnings Call, Feb 03, 2026 · 2026-02-03T16:00:00 | Erik Hirsch | pending | A 10-year Guardian commitment; the Q4 2026 call confirmed the partnership closed and initial economics began, but the multiyear inflows are still ramping. |
| “We expect that over half of that current $1 billion will move into specialized fund fee-earning AUM during the calendar fourth quarter of 2025” | Hamilton Lane Incorporated, Q2 2026 Earnings Call, Nov 04, 2025 · 2025-11-04T15:00:00 | Erik Hirsch | kept | The Q3 2026 call reported that Evergreen non-fee-earning AUM turned to fee-earning AUM in the quarter, consistent with this expectation. |
| “our Board has approved a 10% increase to our annual fiscal dividend to $2.16 per share or $0.54 per share per quarter” | Hamilton Lane Incorporated, Q4 2025 Earnings Call, May 29, 2025 · 2025-05-29T15:00:00 | John Oh | kept | The $0.54 quarterly dividend was reaffirmed through fiscal 2026, and the board subsequently raised the annual dividend 11% to $2.40 on the Q4 2026 call. |
| “we expect that to be at a run rate of about $30 million per year” | Hamilton Lane Incorporated, Q3 2025 Earnings Call, Feb 04, 2025 · 2025-02-04T16:00:00 | Jeffrey Armbrister | kept | Reaffirmed on later calls as an ongoing multiyear run-rate tied to the performance awards granted to leadership. |
Q&A pressure map
Question counts and firms are curator tallies; analyst coverage shown above.
| Topic | Questions | Firms | Pressure / response |
|---|---|---|---|
| Evergreen flows, redemptions and liquidity risk | 9 | Goldman Sachs, Morgan Stanley, KBW | The most-pressed area across the last four calls (Q1-Q4 fiscal 2026), covering institutional-versus-retail demand, monthly flow deceleration, and liquidity-cap handling. On the latest call, management answered the specific question of redemptions exceeding the cap for an extended period only in general terms (cash reserves, lines of credit, diversification), which reads as a partial non-answer to that scenario. |
| Wealth and wirehouse distribution pipeline | 7 | JPMorgan, BMO Capital Markets | Repeated pressure across the last four calls on product roadmap, wirehouse placement, model portfolios and the Park Avenue Securities relationship; management consistently notes it does not control platform placement. |
| Secondaries sizing, selectivity and incentive-fee marking | 4 | JPMorgan, UBS | Across the last four calls, analysts probed Fund VII relative size, why the bulk of deal flow is declined, and the day-1 NAV mark; management ties selectivity to quality screening and marking to industry-standard accounting. |
| Exit and monetization outlook | 3 | Morgan Stanley, KBW | Recurring across the last four calls; management attributes an improving outlook to asset aging and better buyer/seller price agreement rather than the IPO market. |
| Software and AI disruption risk in portfolios | 2 | Goldman Sachs, UBS | A focused burst on the Q3 2026 call; management argued its co-investment/secondary model leaves it diversified and that AI risk to software is company-specific, not systemic. |
Language shifts
Only language evidence verified against the referenced component is shown.
| Observation | Verbatim evidence | Call ID | Component |
|---|---|---|---|
| Management began pre-emptively rebutting a broad private-credit 'crisis' narrative, a defensive framing absent from earlier calls that discussed credit mainly as a growth opportunity. | “we see no data to support this notion, particularly within the context of private credit” | 1966009827 | 2 |
| For the first time, management characterized the Evergreen operating environment as adverse, a departure from the uniformly 'record flows' language of prior quarters. | “an extremely challenging backdrop for Evergreen funds in calendar Q1” | 1997245989 | 2 |
| New acknowledgment of industry-wide redemption pressure entered the vocabulary, contrasted against Hamilton Lane's own positive flows. | “the industry has seen elevated redemption requests, particularly in private credit Evergreen funds” | 1997245989 | 2 |
| AI-disruption risk to software holdings emerged as a topic management felt compelled to address, a caution vocabulary not present in earlier calls. | “the notion that every software business is going to suffer hugely negative consequences due to AI, I think, is not true.” | 1977984057 | 26 |
Across roughly two years of calls the through-line is a steady mix shift toward higher-fee Evergreen and specialized funds, reinforced by secondaries and technology partnerships. The most recent quarter is the first to test that story: management acknowledged a challenging calendar Q1 for Evergreen, flows slowed into March and April, and analysts turned to redemption liquidity and secondary-mark methodology. Net inflows and marks have held so far, so the call history reframes the current debate less as whether Evergreen can grow and more as how durable those flows and valuations are under stress.
Hamilton Lane: the business and the setup
Hamilton Lane manages and advises on roughly $1.0 trillion of private-markets capital, earning most of its money from recurring management and advisory fees that have grown every year. It is well-run, highly profitable, and controlled by its own people. It is also a stock the market has sharply repriced: from a November 2024 peak of $201.62 the shares have fallen to $83.16, about 59%, and now trade near 14 times trailing earnings. This report works through whether that fall is an opportunity or a repricing.
What the company does
Assets Under Advisement
Discretionary AUM
Fee-Earning AUM
Source: FY2026 Form 10-K, Item 1 Business [1]; Fee-Earning AUM, MD&A [2].
Hamilton Lane is a private-markets investment manager founded in 1991 and based in Conshohocken, Pennsylvania. It helps institutions and, increasingly, wealthy individuals build and oversee portfolios of private equity, private credit, real estate, infrastructure and other private assets. As of March 31, 2026 it had approximately $142 billion of discretionary assets under management and approximately $905 billion of non-discretionary assets under advisement — about $1.0 trillion in total [3].
The discretionary book, where the company decides how the money is invested and earns the higher fees, splits into two parts: roughly $92 billion in customized separate accounts built for a single large client, and roughly $50 billion in specialized commingled funds — including the fast-growing "evergreen" (perpetual, semi-liquid) vehicles aimed at private-wealth investors [4]. The business is asset-light: it invests other people's capital rather than deploying a large balance sheet of its own, and the client base is granular, with no single client representing more than 2% of management and advisory fee revenue [5].
How the money is made
Source: FY2026 Form 10-K, Consolidated Statements of Operations and MD&A [6]; incentive fees include consolidated funds [7].
Two revenue streams matter. The larger and steadier is management and advisory fees: $584.2 million in FY2026, or about 77% of total revenue, up from $513.9 million in FY2025 and $451.9 million in FY2024 [8]. Much of this fee base is contractual and long-dated, charged on committed or invested capital rather than on market value, which makes it resistant to short-term swings in asset prices [9]. The FY2026 increase came mostly from evergreen funds, which added $72.1 million of revenue and $7.1 billion of fee-earning AUM year over year [10].
The second stream is incentive fees — carried interest and performance fees, generally 5.0% to 12.5% of fund profits above a return threshold [11]. These are inherently lumpy: they depend on realized investment performance over multi-year periods, can be subject to clawback, and are not booked until a reversal is improbable [12]. They fell to $174.8 million in FY2026 from $199.1 million in FY2025 [13], even as the recurring fee base kept climbing — a useful early illustration of where the earnings are steady and where they are not. Behind them sits about $1.5 billion of unrecognized carried interest as of March 31, 2026, a store of value that converts to revenue only as underlying investments are realized [14].
The company reports fee-related earnings (FRE) to isolate the profit from that recurring fee engine, stripping out variable carry. FRE has compounded steadily: $206.7 million in FY2024, $276.5 million in FY2025, $344.5 million in FY2026 [15].
The financial record, in brief
Fee-Related Earnings ($M)
Adjusted EBITDA ($M)
Non-GAAP EPS
Return on Equity
Source: FY2026 Form 10-K, Non-GAAP measures [16], Non-GAAP EPS [17]; ROE derived from reported financials.
The company earns high returns on a small asset base. FY2026 GAAP diluted earnings were $5.92 per Class A share, up from $5.41 in FY2025 and $3.69 in FY2024, and the board declared $2.16 per share in dividends [18]. On a non-GAAP basis, which management uses to reflect the full economic share count, earnings were $5.90 in FY2026, $5.04 in FY2025 and $3.92 in FY2024 [19]. Capital intensity is minimal, so most of that profit converts to cash. A fuller three-year and forward-estimate walk — the reader's standing request for a dedicated financials view — is left to its own chapter; the point here is only the shape: a recurring engine compounding in the mid-teens, with a variable carry stream layered on top.
What the stock has done
Source: daily market prices, as reported; fiscal year ends March 31, latest close July 24, 2026.
The shares went public in March 2017 near $18 and compounded steadily for seven years, closing at $148.67 on March 31, 2025. They then peaked at $201.62 on November 11, 2024 before turning down. At $83.16 on July 24, 2026 the stock is about 59% below that peak and near its 52-week low of $73.79. The multiple compressed with it: at the November 2024 peak the shares changed hands at roughly 40 times the $5.04 of non-GAAP earnings the company went on to report for FY2025; at $83.16 they trade near 14 times the $5.90 reported for FY2026 [20], and near 13 times the $6.26 consensus expects for the year now underway. The $2.16 dividend is a yield of about 2.6% at the current price [21].
One marker of how far sentiment has swung: the current price sits below the entire published range of sell-side price targets, which runs from a low of $94 to a high of $174, with a mean near $127. That is unusual: the price sits below the entire published target range even as consensus still models meaningful upside.
Source: analyst price targets and consensus EPS, as reported.
Ownership and control
The people who run Hamilton Lane own a large slice of it and control the vote. The company uses a dual-class, "Up-C" structure: public investors hold low-vote Class A stock, while management, employees and long-tenured insiders hold Class B/C units that carry the majority of the vote and can be exchanged into Class A. As of the July 2026 proxy, all current executive officers and directors as a group held about 64% of combined voting power and roughly 25% of the economic interest [22]. Notably, the two co-CEOs received no new stock or option awards in FY2026 — their compensation is salary and cash bonus on top of stakes they already hold [23]. For an investor who prizes skin in the game, the alignment is real; the flip side — that outside shareholders are minority voters in a founder-controlled firm — is a governance fact to weigh, not a verdict, and gets its own treatment later.
The question this report works through
Hamilton Lane is a high-quality, insider-controlled private-markets manager whose recurring fee engine has compounded for years and whose shares have since fallen about 59% from their late-2024 peak to roughly 13 to 14 times earnings. The question this report works through: is that de-rating handing a value-minded investor a durable, well-aligned compounder at a genuine margin of safety — or is the market correctly repricing decelerating AUM growth, increasingly lumpy incentive fees, and a private-markets cycle that may be past its peak? Everything that follows tests one side of that question or the other.
The three-year record
Hamilton Lane's reported numbers do three things at once: a management-fee base that compounds in the mid-teens, a headline earnings figure inflated by lumpy incentive fees and balance-sheet investment gains, and a "recurring earnings" measure (FRE) that is itself leaning more on performance-linked revenue than the label suggests. Revenue reached $759.0M in fiscal 2026 and GAAP diluted EPS $5.92; the fee engine is real, but reported EPS is a noisier read on it than FRE.
FY26 Revenue ($M)
Fee-Related Earnings ($M)
Non-GAAP EPS
GAAP Diluted EPS
Dividend / Share
Source: FY2026 Annual Report (Form 10-K), Consolidated Statements of Operations [1] and non-GAAP reconciliation [2].
The revenue engine and where it comes from
The income statement separates cleanly into two streams. Management and advisory fees — contractual, long-dated, and tied to fee-earning assets — rose from $451.9M in FY2024 to $584.2M in FY2026, a 13.7% two-year CAGR that never dipped [3]. Incentive fees — carried interest and performance fees that crystallize on realizations — did the opposite, falling from $199.1M in FY2025 to $174.8M in FY2026 even as the fee base grew [4]. Management and advisory fees supplied 77.0% of FY2026 revenue; incentive fees the remaining 23.0%.
Source: FY2026 Annual Report (Form 10-K), Consolidated Statements of Operations; incentive fees shown inclusive of Consolidated Funds [5] [6].
The steadiness of the top line is a feature of the model, not the year. Because fees are earned on committed and fee-earning capital that turns over slowly, revenue grew through the FY2024–FY2026 window even as the incentive-fee stream swung — the mechanics behind the Fees and De-Rating split. Total expenses grew broadly in line, from $308.0M to $434.0M, keeping GAAP net income attributable to Hamilton Lane rising from $140.9M to $249.2M [7].
From revenue to earnings — three ways to count it
Hamilton Lane reports its results three ways, and the gaps between them are where the analysis lives. GAAP diluted EPS was $5.92 in FY2026, up from $3.69 two years earlier [8]. Non-GAAP EPS — which taxes pre-tax income at a full statutory rate and assumes all Class B/C units convert to Class A — was $5.90, built from adjusted net income of $321.2M [9]. Both of those figures still carry the firm's investment income; only Fee-Related Earnings strips it out to isolate the fee business.
Source: FY2026 Annual Report (Form 10-K), FRE / Adjusted EBITDA reconciliation [10] and Non-GAAP EPS reconciliation [11].
FRE, which management uses to isolate recurring-fee profit — it is meant to capture "earnings from revenues that are measured and received on a recurring basis" [12] — grew from $206.7M to $344.5M, a 29.1% two-year CAGR, well ahead of the 13.7% pace of the management-fee base [13]. Part of that gap is genuine operating leverage: the FRE margin on fee-related revenue widened from 45.5% in FY2024 to 50.2% in FY2026.
Source: derived from reported financials — FRE divided by management/advisory fees plus fee-related performance revenues, FY2024–FY2026 [14].
What is inside "recurring"
The rest of the FRE gap is a composition shift worth naming. Inside the FRE build sits a line called fee-related performance revenues (FRPR) — incentive fees the company judges to be "measured and received on a recurring basis and not dependent on realization events," largely from its evergreen and perpetual funds [15]. FRPR rose from $2.4M in FY2024 to $59.6M in FY2025 to $102.5M in FY2026 [16]. Of the $137.8M by which FRE grew over two years, $100.1M — about 73% — came from that single line.
FRPR is a performance-based revenue that Hamilton Lane counts inside its recurring-earnings measure. It grew from $2.4M to $102.5M in two years and supplied roughly 73% of the two-year rise in Fee-Related Earnings. The counter-fact: FRPR is drawn from evergreen and perpetual vehicles whose fees recur without a sale event, so it is more durable than realization-based carry — but it is still performance-linked, and it means FRE growth is less purely "fee" than a first read of the label implies.
This does not undo the FRE story — evergreen performance revenue that does not need an exit is a better annuity than traditional carry — but it changes how a reader should weight it. The clean, contractual core is the management-fee line growing near 14% a year; FRE grows faster partly because it now folds in a performance stream that scales with markets. What would change the read: a market drawdown that stalls or reverses FRPR would slow FRE well below its 29% trailing pace while management fees kept compounding.
Cash conversion and the balance sheet
The business is asset-light and cash-generative. Capital expenditure was $5.8M in FY2026 against $424.9M of operating cash flow, and depreciation runs under $10M a year [17]. Operating cash flow is lumpy — $120.9M in FY2024, $300.8M in FY2025, $424.9M in FY2026 — because incentive-fee receipts and fund-related timing move it around, but the multi-year direction is up and comfortably covers the $87.7M of dividends paid [18].
Source: FY2026 Annual Report (Form 10-K), Consolidated Statements of Cash Flows [19].
For a reader who wants the chance of bankruptcy near zero, the balance sheet is the reassuring part of this file. At March 31, 2026 Hamilton Lane held $361.0M of cash against $278.4M of debt — a net cash position — alongside $774.4M of balance-sheet investments [20]. Debt is 0.30x equity, and there is no capital-intensive asset base to impair. The balance-sheet item that carries into the ownership chapter is the $235.4M payable to related parties under the tax receivable agreement — a real, scheduled cash obligation to pre-IPO owners that diverts cash away from Class A holders over time [21]; its size and cadence belong in the ownership and alignment discussion, not here.
Cash ($M)
Debt ($M)
Debt / Equity
TRA Payable ($M)
Source: FY2026 Annual Report (Form 10-K), Consolidated Balance Sheets [22].
What the forward estimates say
Consensus does not model a broken business. On mean estimates, revenue grows from $759.0M in FY2026 to $904.2M in FY2027 and $1.05B in FY2028; non-GAAP EPS moves from $5.90 to $6.26 and then $7.36. The shape is worth reading closely: FY2027 revenue is modeled up about 19% but EPS up only ~6%, because FY2026 earnings were flattered by elevated incentive fees and investment gains that create a tough comparison, before EPS reaccelerates ~18% in FY2028 as the fee base scales.
Source: FY2026 actual per Form 10-K [23]; FY2027–FY2028 consensus analyst estimates (mean), as reported.
Source: FY2026 actual per Form 10-K non-GAAP reconciliation [24]; FY2027–FY2028 consensus analyst estimates (mean), as reported.
At the current $83.16, those estimates put the shares on 13.3x FY2027 and 11.3x FY2028 earnings — the valued-cheaply half of the Fees and De-Rating picture, quantified forward. The sell-side is aligned with that: seven analysts publish, six of seven rate the stock buy or better, and the mean price target of $126.86 (range $94 to $174) sits above the current price. Near-term conviction is firming while the out-year drifts — FY2027 EPS saw four upward revisions against two down over the last month, but FY2028 saw one up against three down.
Price
P/E (FY27E)
P/E (FY28E)
Mean Target
Source: price and consensus analyst estimates (mean), as reported; multiples derived from consensus EPS of $6.26 (FY2027) and $7.36 (FY2028).
The forward numbers are a coherent bull case: mid-teens revenue growth, a fee base that compounds without a realization cycle, net cash, and a multiple well below the firm's own history. Consensus EPS still leans on incentive fees and investment gains FRE excludes, so the durable rate is closer to the low-to-mid-teens management-fee line; fee-earning AUM is the input that turns into next year's management fees.
Ownership and Pay
Hamilton Lane is a controlled company, and for an outside buyer the vote and tax structures resolve to a single fact. Insiders steer 64% of the vote on 25% of the economics while public holders also fund a $235.4M tax-receivable-agreement payable that accelerates to a lump sum on any change of control, so the same block that governs Hamilton Lane also makes it effectively unsellable without insider consent. [1][2][3]
The stakes are concrete for anyone underwriting a takeover premium. The $235.4M payable is about 26% of the company's $915.2M of equity, routes 85% of the structure's tax savings to the pre-IPO owners, and on a change of control converts into a lump-sum present value that can exceed the cash taxes actually saved — stacked on the roughly 74% of the vote the stockholders-agreement group controls, which leaves no takeout or control-premium optionality for a special-situation buyer. [4][5][6][7] The counter is genuine alignment rather than extraction: the same insiders hold their wealth in the identical economics public holders own [8], their largest awards vest only if the shares roughly double and they stay five years [9], and the payable is self-funding — a share of a tax benefit the structure itself creates, not incremental leverage [10].
Control on a quarter of the economics
Hamilton Lane carries two classes of common stock. Class A — the listed shares — carry one vote each. Class B shares, which are not publicly traded, carry ten votes each until a "sunset" tied to the tenure of Executive Co-Chairmen Hartley Rogers and Mario Giannini, and collectively hold 73.0% of the combined voting power [11]. A stockholders agreement binds most of those Class B holders to vote as instructed by HLA Investments, LLC ("HLAI"), the company's controlling stockholder; the parties to that agreement control roughly 74.0% of the vote [12].
The gap between votes and economics is the defining feature of the structure. As a group, current executive officers and directors held 3.3 million Class A shares (8% of the class) and 10.0 million Class B shares (84% of the class) as of the July 13, 2026 record date — 64% of the total vote against a 25% economic interest in the underlying operating company, HLA [13]. HLAI alone holds 8.1 million Class B units: 50% of the vote on 15% of the economics [14].
Officers & Directors — Voting Power
Officers & Directors — Economic Interest
HLAI Vehicle — Voting Power
Class B — Combined Voting Power
Sources: 2026 Proxy Statement, Ownership of Common Stock [15]; FY2026 Form 10-K, Voting Rights [16].
The same asymmetry runs the other way for outside institutions. BlackRock owned 4.0 million Class A shares — 10% of the class and 7% of the economics — but only 2% of the vote; Kayne Anderson Rudnick's 3.4 million shares translate to 6% of the economics and 2% of the vote [17]. Money without votes on one side; votes without proportionate money on the other.
Source: 2026 Proxy Statement, Ownership of Common Stock [18].
Because HLAI and the stockholders-agreement group control a majority of the vote, Hamilton Lane qualifies as a Nasdaq "controlled company" and has elected the exemptions that go with it: it is not required to maintain a majority-independent board, an independent nominating process, or a fully independent compensation committee [19]. The compensation committee is in fact chaired by Rogers, a non-independent executive officer, under that exemption [20]. The certificate of incorporation also carves HLAI and its affiliates out of the anti-takeover protection that would otherwise apply to a 15%-plus "interested stockholder," so the control block can add to its position without the restrictions that constrain an outside acquirer [21]. A public Class A holder owns economics and the right to be carried along, not a vote that decides anything.
Skin in the game, not just control
Control and alignment are not the same thing, and Hamilton Lane is a case where they mostly point the same way. The pre-IPO owners — Rogers, Hirsch, Kramer and others — hold the substantial majority of their stake as Class B and Class C units of the operating company rather than as listed HLI stock, and those units exchange one-for-one into Class A shares [22]. Rogers' 12% economic interest in HLA dwarfs his cash pay by orders of magnitude [23]. Every equity award and open-market purchase by a named executive since the IPO has been denominated in the same Class A stock public holders own [24]. The people running the firm are, first and foremost, its largest shareholders — which is the version of insider control a long-term owner would prefer to the alternative.
Pay: cash-modest, equity-gated
Headline cash compensation is restrained for a firm of this size. For fiscal 2026 co-CEO Erik Hirsch earned $3.46 million and co-CEO Juan Delgado-Moreira $2.69 million — each a $325,000 salary plus a discretionary cash bonus and carried-interest distributions, with no new stock awards recorded in the year [25]. That "no equity" line is a timing artifact rather than a policy: it sits between two large equity events.
Source: 2026 Proxy Statement, Summary Compensation Table [26].
The fiscal 2025 numbers are not a typo. Each co-CEO was granted roughly $76 million of stock that year — the 2024 Performance Awards, made when Hirsch and Delgado-Moreira stepped up to run the firm [27]. These are not ordinary time-vesting shares. Each award covers about 544,000 shares that vest only as the stock's 20-day average closing price reaches $150, $190 and $230 — in thirds — within seven years, and only if the executive is still employed at least five years after grant [28]. The first two price hurdles were touched during the late-2024 share-price spike, but the five-year service clock had not run as of March 31, 2026, and the $230 tranche remains unmet [29]. With the shares back near $83, the top tranche is deep out of the money and the whole award pays fully only if the stock roughly triples off the recent price and the co-CEOs stay through the end of the decade.
The performance discipline extends below the top. A new form of award introduced in September 2025 — granted to the CFO, COO, General Counsel and Chief Accounting Officer — forfeits entirely unless total shareholder return compounds at 8% a year over five years [30]. And the co-CEOs receive a separate series of five annual grants of 30,000 restricted shares each; the second, valued at $79.92 a share, was granted in May 2026 and will land in fiscal 2027 pay — which is why fiscal 2026 shows zero [31].
One feature cuts against the "clean, recurring-fee" reading of the business a value investor might want. The discretionary bonus pool is sized in part by the company's incentive-fee revenue and investment gains on its own balance sheet — the lumpy lines [32]. And carried-interest distributions, reported in "All Other Compensation," rose and fell with realizations: Hirsch's other compensation was $1.87 million in fiscal 2025 and $0.62 million in fiscal 2026 [33]. Management pay, like the earnings, has a variable, market-sensitive component sitting inside an otherwise steady structure.
The tax receivable agreement
The Up-C structure carries a standing cash claim by the pre-IPO owners. When Hamilton Lane bought HLA units at the IPO, and each time a legacy holder later exchanges units for stock, the company picks up additional tax basis that reduces its future cash taxes. Under the tax receivable agreement, 85% of those tax savings are paid back to the legacy members; the company and its public stockholders keep the remaining 15% [34].
The recorded obligation was $235.4 million at March 31, 2026, little changed from $240.6 million a year earlier [35], and each new exchange adds to it — fiscal 2026 exchanges established a further $10.3 million of liability [36]. That balance is about a quarter of the company's $915 million of equity. In practice the drain is gradual: a portion of the individually named fiscal-2026 payments went to insiders and other pre-IPO owners, led by Giannini ($3.19 million), Rogers ($2.20 million, plus $1.21 million to his HRHLA vehicle) and Hirsch ($1.18 million) [37].
Source: 2026 Proxy Statement, Certain Relationships and Related-Party Transactions [38].
Two features deserve a professional buyer's attention. First, the payments are self-funding in the ordinary case: they equal 85% of a tax saving that the structure itself creates, so absent taxable income the company generally owes nothing that year — this is a share of a benefit, not incremental leverage [39]. Second, a change of control accelerates the whole obligation into a lump-sum present value of anticipated future benefits, computed on assumptions that could exceed the cash taxes actually saved [40]. Stacked on HLAI's voting control, that acceleration is another reason the company is effectively unsellable without insider consent — a point that matters for anyone underwriting a takeover premium into the case.
What it means, and what to watch
The evidence points to genuine alignment sitting inside firm insider control. Management's wealth is overwhelmingly in the same stock public holders own, and the largest pay awards only pay if the shares roughly double or triple and the executives stay for years [41]. The strongest fact against reading that as unambiguously shareholder-friendly is structural, not behavioral: a public Class A holder has no effective vote, cannot force a sale, and funds an 85% tax-savings stream to the pre-IPO owners that stands ahead of them — a modest but permanent economic toll of roughly a quarter of book equity today [42].
What would change the read, in either direction, is checkable on the tape. Sustained insider selling through unit exchanges would signal a quiet sell-down; the same exchanges enlarge the tax receivable liability, so the two move together. A downward reset of the co-CEOs' $230 price hurdle or the 8% TSR threshold after the de-rating would weaken the pay-for-performance story that currently looks tight. And the annual cadence of tax-receivable payments, set against the roughly $425 million of operating cash flow the business now generates [43], is the line that shows whether the structure's cost to public holders stays modest as more units convert. For now, the company is buying back stock — the board lifted the repurchase authorization to $100 million in May 2026 — and raised the quarterly dividend to $0.60, so cash is still reaching Class A holders even as it flows to the pre-IPO owners [44].
Growth Engine
The line that drives Hamilton Lane's forward case is not headline EPS but fee-earning AUM — the slice of assets that actually pays management fees. It compounded to $81.5 billion at March 2026, up $9.5 billion or 13% in the year, and its mix is tilting toward higher-fee specialized and evergreen funds, lifting the blended fee rate from 64 to 67 basis points in twelve months [1] [2]. The private-markets tailwinds behind that growth are real; how much of them is structural rather than cyclical is the open question this chapter takes up.
What earns the fee
Of Hamilton Lane's roughly $1.0 trillion of assets under management and advisement, only $81.5 billion is fee-earning AUM — the discretionary capital in customized separate accounts and specialized funds on which the firm charges a recurring management fee [3] [4]. The $905 billion of advisory assets under advisement carries far thinner, mostly fixed reporting fees; the $142 billion headline discretionary AUM includes committed-but-not-yet-fee-paying capital. Fee-earning AUM is the number the management-fee line — the durable fee stream established in Financials and Estimates — is built on.
That base has compounded steadily. Fee-earning AUM roughly doubled over six years, from $38.7 billion in FY2020 to $81.5 billion in FY2026, a mid-teens annual rate through a full market cycle.
Source: fee-earning AUM roll-forward and prior-year balances, FY2026 and FY2022 Form 10-Ks [5].
Fee-Earning AUM (FY26)
YoY Growth
Blended Fee Rate (bps)
Sources: fee-earning AUM, FY2026 10-K [6]; blended fee rate, Q4 FY2026 earnings call [7].
The mix is doing extra work
The composition matters as much as the total. Specialized funds — the drawdown and evergreen vehicles that carry higher fee rates — grew fee-earning AUM from $18.2 billion in FY2022 to $40.6 billion in FY2026, a 22% annual rate. Customized separate accounts, the lower-fee institutional business, grew from $30.9 billion to $40.9 billion, about 7% a year [8]. Specialized funds crossed half of fee-earning AUM in FY2026, up from roughly 37% four years earlier.
Source: derived from fee-earning AUM balances, FY2026 and FY2022 Form 10-Ks [9].
Because the faster-growing part of the base is also the higher-fee part, management fees grow faster than the assets underneath them. Management and advisory fees compounded about 13.7% a year over FY2024–FY2026 while fee-earning AUM compounded about 11.3% — the roughly two-point gap is the mix-driven lift in the blended fee rate, which rose from 64 basis points in June 2025 to 67 a year later [10] [11]. This is the clearest quality signal in the growth story: Hamilton Lane is not buying growth by discounting fees, it is earning more on each dollar as the product mix improves.
Where the flows come from
The FY2026 fee-earning AUM roll-forward shows $15.0 billion of gross contributions against $7.6 billion of distributions, plus $2.1 billion of market and currency effect — organic inflows, not market appreciation, did most of the work [12].
Source: fee-earning AUM roll-forward, FY2026 Form 10-K [13].
One product line supplied most of the growth. Evergreen funds — continuously offered, semi-liquid vehicles that span private equity, secondaries, private credit, infrastructure and venture — added $7.1 billion of fee-earning AUM year-over-year and lifted specialized-fund revenue by $72.1 million, roughly three-quarters of the year's entire fee-earning AUM increase [14]. Roughly three-quarters of FY2026's fee-earning-AUM growth and about 73% of the two-year Fee-Related-Earnings increase both trace to the same ~$14.3B evergreen NAV layer — only ~18% of the fee base and charged on high-water-marked NAV — so Hamilton Lane's growth engine, its earnings-quality overhang, and its cyclical exposure are one and the same asset. Management calls the evergreen platform "a key contributor to our growth," and the buyer base is broadening past the original high-net-worth channel: institutions — pensions, endowments, insurers — now account for over 25% of the capital flowing into the evergreen products [15] [16].
Two adjacencies are worth naming because they feed the same base. Private credit fee-earning AUM reached nearly $4 billion across closed-end and evergreen vehicles, compounding at more than 45% off a small base [17]. And in November 2025 Hamilton Lane signed a long-term partnership with Guardian Life: it will manage Guardian's roughly $5 billion existing private-equity portfolio, receive about $500 million of new commitments per year for at least ten years, and take $250 million of seed capital for its evergreen funds — Guardian receiving HLNE warrants in exchange [18] [19]. The Guardian deal is a template for the insurance channel that larger managers are also chasing.
Tailwind or cyclical peak
The question is whether the forces behind the fee-earning AUM ramp are durable, or the industry is simply passing a good point in the cycle. The evidence cuts both ways, and the distinction shapes how much of the consensus revenue ramp a reader should trust.
The structural case is that private-markets allocation is still rising and access is widening. Hamilton Lane's own 10-K frames it plainly: with rates elevated and public-equity returns dispersed, investors "continue to see demand for alternative investments," and new vehicle types keep expanding who can buy them [20]. Larger peers describe the identical vector — Blackstone points to "structural tailwinds" and "the vast private wealth and insurance channels" as the growth frontier [21]. The private-wealth-and-insurance adoption curve, the evergreen wrapper, and secondaries as a permanent liquidity mechanism are genuinely secular, not one-year phenomena.
The cyclical reading is harder to dismiss, and Hamilton Lane's own commentary supplies it. Much of FY2026's strength coincides with a private-markets cycle turning up off a weak base: global buyout deal volume rose more than 40% in 2025, exit value climbed nearly 50% to the second-best year on record, and secondary transaction volume hit a record $240 billion [22]. Those are recoveries from a two-year distribution drought, and they flatter flows, NAV growth on the evergreen books, and secondary deployment alike. The same 10-K section that lists the tailwinds also lists the risks a bull must hold in view: fee compression, shifting institutional allocation policies, and rising barriers to growth [23].
The read here: the growth is real and improving in quality — fee-earning AUM compounding in the mid-teens with a rising fee rate is a better fact pattern than the headline AUM CAGR alone suggests, and the evergreen/insurance flows have a secular core. But the pace is mid-teens, not the 20%-plus of the largest scaled managers, and a meaningful part of FY2026's inflows rode a cyclical rebound in exits and secondaries. The strongest counter to a purely structural story is that the separate-account business — nearly half of fee-earning AUM — grows only about 7% a year and management itself flags its timing as "unpredictable." What would change the read: a slowdown in evergreen net subscriptions or a stall in the fee-rate climb below the high-60s would signal the mix-shift lift is maturing; sustained double-digit fee-earning AUM growth through the next exit slowdown would confirm the secular case. Both are visible quarter to quarter in the fee-earning AUM roll-forward and the blended fee rate — the two inputs to track ahead of reported EPS.
Competitive Position
Hamilton Lane's edge is real but narrow. Four decades as one of the largest allocators of primary capital buy it privileged access to fund managers and a data set rivals cannot cheaply rebuild [1]. The evidence sits in the fee line: a blended rate that rose to 67 basis points while StepStone's slipped to 63, and a fee-related margin near 50% against GCM Grosvenor's 44.5% [2]. But it is not the scale leader, the data edge is shared, and the filings flag fee compression.
Where the advantage comes from
Hamilton Lane sells access and information, not a brand. Because it is one of the largest allocators of primary capital to the world's leading fund managers, it is a client those managers want to keep — which is what secures allocation to oversubscribed funds, secondary deal flow, and co-investment on the same terms as the lead sponsor [3]. That scale is self-reinforcing on the data side. The firm oversees roughly $1.0 trillion of assets, of which $905 billion is low-fee advisory work it keeps partly because, in its own words, the advisory book is "a meaningful benefit in terms of the amount of data we are able to collect and the degree of influence we have with fund managers" [4]. The private markets are defined by "the limited availability and inconsistency of quality information," and Hamilton Lane's stated strategy is to turn its proprietary databases and analytics into products competitors lack [5]. Cobalt, its subscription data platform, is now a distinct revenue line inside the reporting-and-analytics segment [6].
A moat is only established when it shows up in numbers rather than adjectives. Three do.
Pricing power, margin, and stickiness
The cleanest signal is the direction of the blended management fee rate. Hamilton Lane's rose over fiscal 2026 to 67 basis points, because its asset mix keeps shifting toward higher-fee specialized and evergreen funds [7]. Over the same window StepStone — the closest listed analog — reported a blended rate of 63 basis points, down from 65 the prior year [8]. Two firms in the same business, pricing in opposite directions.
Prior = FY2025 / start of FY2026; latest = most recent disclosure. Sources: Hamilton Lane Q4 FY2026 call [9]; StepStone Q3 FY2026 call [10].
The rate difference flows to profitability. Hamilton Lane's fee-related earnings reached $344.5 million in fiscal 2026, a margin just above 50% on fee-related revenue [11]. GCM Grosvenor, running the same solutions model, earned $185.1 million of fee-related earnings on $416.3 million of fee-related revenue — a 44.5% margin [12]. A five-point margin gap on similar revenue is what an information and scale advantage looks like when it is working.
The third signal is client stickiness. No single client is more than 2% of management and advisory fees; the top 10 supply roughly 11% and the top 20 about 16%, and every one of those top 20 holds multiple products or mandates [13][14]. The base spans over 2,800 institutions and intermediaries, with 61% of fee revenue sourced outside the United States [15]. Separate-account contracts run up to 12 years or indefinite terms, so a client that wants to leave carries multi-year commitments and the switching cost of re-underwriting a whole private-markets program [16].
Blended fee rate (bps)
Fee-related margin
Largest single client
Longest SMA term (yrs)
Sources: blended fee rate and margin, FY2026 10-K and Q4 FY2026 call [17][18]; client concentration and contract terms, FY2026 10-K [19][20].
Where the moat is thinner than the story
The advantage has three real limits, and honest benchmarking against the true peer set — StepStone and GCM Grosvenor, the two listed firms that run the identical separate-accounts-plus-specialized-funds-plus-secondaries model — surfaces them.
First, Hamilton Lane is not the scale leader it is often assumed to be. StepStone's fee-earning AUM reached $144.0 billion in the year to March 2026, up 19%, against Hamilton Lane's $81.5 billion, up 13% [21]. A close competitor is both larger on the metric that generates management fees and growing it faster. GCM Grosvenor is smaller, with $72.5 billion of fee-paying AUM growing about 12% [22][23].
Fee-earning AUM (HLNE, STEP) and fee-paying AUM (GCMG) are the near-equivalent fee bases; definitions differ modestly across firms. Blank cells not disclosed on a comparable basis. Sources: HLNE FY2026 10-K and Q4 FY2026 call [24][25]; StepStone 10-K, year ended March 31 2026 [26]; GCM Grosvenor FY2025 10-K and Q4 FY2025 call [27][28].
The read on that table: Hamilton Lane wins on price and margin, StepStone wins on size and growth. That is the profile of a firm harvesting a quality book rather than one out-compounding its field — a distinction that bears directly on whether the compounding is durable — and the fastest grower in the peer set is charging less to get there.
Second, the data advantage is genuine but not unique. StepStone attributes its own share gains to "our data-driven insights as a major market participant," and GCM Grosvenor and P10 make comparable claims about proprietary data and analytics. Several scaled players now hold decades of private-markets data; Hamilton Lane's is among the deepest, but it is a shared category of advantage, not a monopoly, and it does not by itself explain the fee-rate gap.
Third, the pricing edge leans on a mix the company itself flags as pressurable. The 67-basis-point blend rose because higher-fee evergreen funds drove roughly three-quarters of fee-earning AUM growth — $72.1 million of incremental specialized-fund revenue in fiscal 2026 [29]. Those fees ride on market-sensitive net asset values, and Hamilton Lane's own MD&A lists "the potential for fee compression" alongside shifting allocation policies as a trend affecting the business [30]. The same section names "increasing barriers to entry and growth" — a moat-positive read — so management sees both forces at once [31].
Sitting behind all three is the larger competitive fact: the giant diversified managers — Blackstone above $1 trillion, Ares above $600 billion — are entering the same private-wealth and secondaries channels with far more brand and distribution, growing AUM north of 20%. Hamilton Lane does not compete with them on scale; it competes on independence, open architecture, and the absence of its own funds to push. That is a defensible position, not an unassailable one.
The read
Hamilton Lane has a narrow moat: an access-and-information advantage, four decades deep, that shows up in a rising fee rate, a class-leading fee-related margin, and mandates that are contractually hard to leave. It is not wide, because a direct peer is larger and faster-growing, the data edge is shared, and the richest part of the fee mix is the part most exposed to a market turn.
What would move the read either way is observable and specific. If the blended fee rate holds or climbs above 67 basis points while StepStone's keeps drifting down, the pricing power is structural and the moat widens. If it rolls over toward the peer trend, if fee-earning AUM growth stays persistently below StepStone's high-teens pace, or if evergreen redemptions and gates surface in a private-markets drawdown, the advantage is closer to good execution in a good industry than a durable moat — and execution, however good, is not a moat.
Valuation
From the November-2024 peak to mid-2026 the share price fell ~59% while non-GAAP EPS rose ~17%, compressing the multiple from ~40x to ~14x — but that low-teens multiple values a Fee-Related-Earnings base whose two-year growth was roughly 73% supplied by a performance-linked FRPR line ($2.4M to $102.5M), so the de-rating partly reprices earnings quality, not just sentiment. Priced against Fee Related Earnings, the ~$4.5B equity is about 13x the $344.5M FRE base; strip the roughly 30% of that base that is performance-linked FRPR (~$102.5M) and the multiple on the ~$242M of clean, management-fee-related earnings is closer to 19x — the 13–14x headline is richer on the durable line than it first appears. Against that, the 13.3x FY2027 and 11.3x FY2028 forward multiples sit demonstrably below Hamilton Lane's own trading history, and the consensus mean target of $126.86 is about 53% above the $83.16 spot. How much of the de-rating is an overreaction and how much a permanent reset of earnings quality is what the rest of this chapter weighs.
Price fell, earnings rose
The stock peaked at a $201.62 close on 11 November 2024. It was still $148.67 at fiscal 2025 year-end (March 2025) and $134.31 as late as December 2025 before the sharp leg down: $99.40 by March 2026 and $83.16 by late July 2026. Two-thirds of the decline is recent, concentrated in calendar 2026.
What did not fall is the earnings base. Fee Related Earnings compounded from $206.7M (FY2024) to $276.5M (FY2025) to $344.5M (FY2026) [1]. GAAP diluted EPS rose $3.69 → $5.41 → $5.92 and the dividend $1.78 → $1.96 → $2.16 [2]. Non-GAAP EPS — the basis consensus uses — went $3.92 → $5.04 → $5.90, on adjusted net income of $321.2M in FY2026 [3].
Source: market price history, as reported; peak close of $201.62 on 11 Nov 2024 and $83.16 on 24 Jul 2026.
The whole drawdown, then, is a change in what the market will pay for a dollar of Hamilton Lane's earnings, not a fall in the earnings themselves.
The multiple, in its own history
Holding earnings on their reported non-GAAP basis, the compression is stark. At the peak the stock changed hands near 40x that year's earnings; today it trades at roughly 14x trailing and 13.3x the FY2027 consensus.
Source: derived from market price ÷ reported non-GAAP EPS — FY2025 EPS $5.04 and FY2026 EPS $5.90 [4]; FY2027/FY2028 on consensus EPS of $6.26 / $7.36.
Put differently: non-GAAP EPS rose about 17% from FY2025 to FY2026 while the price fell 59%, so the multiple did all the work — contracting roughly 65%. A 40x multiple prices in years of premium compounding; a 13x multiple prices in something much closer to a mature, cyclically-exposed fee stream. The market has moved Hamilton Lane from the first bucket toward the second.
What $83 buys today
Price (24 Jul 2026)
Forward P/E (FY27E)
Dividend Yield
Upside to Mean Target
Sources: price and consensus mean target ($126.86) as reported; dividend of $2.16 per share [5]; FY2027 consensus EPS $6.26.
At $83.16, buyers pay 13.3x FY2027 and 11.3x FY2028 consensus EPS ($6.26 and $7.36) for a business earning a 27% return on equity and a ~50% fee-related margin. That is a 7.5% forward earnings yield plus a 2.6% dividend that has been raised every year. On roughly 54.5M fully-exchanged shares, the equity is valued near $4.5 billion.
The tension with the growth this report has already documented is the point. Consensus models revenue up about 19% in FY2027 and 16% in FY2028, and management fees compounding on fee-earning AUM that grew to $81.5 billion (see Growth Engine). A low-teens multiple applied to double-digit forward growth implies the market either doubts the growth or expects the multiple itself to keep falling. The arithmetic does not decide which — it only frames how much pessimism the price now carries.
A margin-of-safety ledger
Several features bound the downside independent of the multiple debate. The balance sheet is net cash — $361.0M against $278.4M of debt — a point established in the Financials and Estimates tab. The board raised the repurchase authorization to $100 million in May 2026, with about $80 million still available and no expiry, having bought 199,000 shares in the March 2026 quarter at an average of $100.43 [6]. That the buyback was executed well above today's price cuts both ways: it signals conviction, but it also means capital was returned at a richer valuation than the one on offer now.
The scenario band below is illustrative — it pairs a plausible earnings path with a multiple, and names the driver behind each. It is a range with its levers, not a target.
Source: illustrative — non-GAAP EPS paths bracket FY2027–FY2028 consensus of $6.26–$7.36; multiples span peer-convergence (bear) to a partial re-rating toward Hamilton Lane's own history (bull).
The bear case is not a collapse: with earnings holding near $6 and the multiple converging toward where the larger, faster-growing StepStone trades, the stock sits in the low-to-mid $70s — a modest loss from spot, not a rout. The base case, roughly consensus earnings at a 14–15x multiple, lands near $95–100. The bull case — mid-teens FRE compounding carrying non-GAAP EPS past $7.40 and a re-rating toward 18–20x — reaches the $130–150 area, which is where the published targets cluster (mean $126.86, high $174, and a low of $94 that still sits above spot). The distribution is asymmetric: net cash, a covered and growing dividend, and rising earnings put a firmer floor under the price than the ceiling is capped, provided the earnings base holds.
Where this read could be wrong
The clean "earnings rose, only the multiple fell" story has a real counter, and it is that the compression may be correct rather than excessive. Three facts cut against the cheapness.
First, the quality of the earnings the 14x is applied to is lower than the headline. Fee-related performance revenues grew from $2.4M to $102.5M in two years and now sit inside "recurring" Fee Related Earnings — a performance-linked, market-sensitive line dressed as annuity revenue, as the Financials and Estimates tab set out. A 14x multiple on partly-performance earnings is not the same bargain as 14x on pure management fees.
Second, Hamilton Lane is not the scale leader. StepStone's fee-earning AUM reached $144.0 billion, up 19%, against Hamilton Lane's $81.5 billion up 13% (Competitive Position) — a direct peer both larger and growing faster while charging less. If the market is repricing Hamilton Lane from premium compounder toward peer-average, a low-teens multiple is the destination, not an anomaly.
Third, the setup is cyclical. Fee-earning AUM has compounded at only about 7% a year since FY2022 once the fee-rate mix-shift is stripped out, and evergreen NAV-based fees — three-quarters of FY2026's growth — would reset lower if the 2025 exit-and-secondaries rebound reverses. How durable that fee base proves through a down market bears directly on whether the low-teens multiple is cheap or fair, and it is examined in Drawdown Resilience.
What would change the read toward "cheap": incentive-fee and FRPR contribution stabilizing rather than falling, evergreen net subscriptions holding through a down market, and fee-earning AUM growth reaccelerating from the high-single digits. What would confirm the bear: another leg of incentive-fee weakness, evergreen redemptions or gates, and the blended fee rate rolling over. At 13x forward, the price already carries a good deal of that bad news — but not the worst of it.
Drawdown Resilience
The case rests on how much of the recurring fee base holds in a downturn. If the fee engine that has compounded through the cycle would reset sharply in a private-markets downturn, the low-teens multiple is fair; if most of it holds, the de-rating overshot. Hamilton Lane earns the majority of its management fees on committed or net-invested capital that does not move with markets — the company estimates a 10% fall in its NAV-based fee base would cost about $23.8 million, roughly 4% of management and advisory fees, and recurring fees rose 18% through the 2022 drawdown. The cyclical exposure is real, but concentrated in a thin, fast-growing top layer: evergreen NAV fees, high-water-marked performance revenue, and carried interest.
The fee base is three different things
A "private-markets manager" sounds fully geared to asset values. Hamilton Lane's fee base is not. Management fees are charged on one of three bases — capital commitments, net invested capital, or net asset value (NAV) — and only the last moves with markets [1]. Drawdown funds charge on committed capital during their multi-year investment period, then step down to net invested capital or NAV; customized separate accounts run largely on commitments or net invested capital [2]. In the company's own framing, "the vast majority of our customized separate accounts and specialized funds earn fees based on commitments or net invested capital, which are not affected by market appreciation or depreciation" [3].
Only the evergreen funds earn fees purely on NAV. Their combined NAV at the end of FY2026 was about $14.3 billion across four vehicles [4] — roughly 18% of the $81.5 billion fee-earning AUM that carries the two customer-facing segments [5]. The rest of the book — customized separate accounts at $40.9 billion and the drawdown portion of specialized funds at roughly $26 billion — is not marked to the market for fee purposes.
Source: FY2026 Annual Report (Form 10-K), fee-earning AUM roll-forward [6] and evergreen fund NAVs [7]; drawdown portion derived as specialized-fund FAUM ($40.6B) less evergreen NAV.
The same roll-forward makes the insensitivity visible: of the $81.5 billion balance, foreign exchange and market value together moved fee-earning AUM by just $2.1 billion in FY2026 — flows and fee-base transitions, not marks, do the work [8].
What a drawdown actually costs — the company's own number
Hamilton Lane quantifies the market sensitivity directly. As of March 31, 2026, a hypothetical 10% decline in the NAV-based fee base, holding all else constant, would reduce management fee revenue by approximately $23.8 million over the following twelve months [9]. Against $584.2 million of management and advisory fees for the year, that is about 4% [10]. A market shock large enough to halve the value of the entire evergreen book still leaves more than four-fifths of the recurring fee line untouched.
Mgmt-fee hit from 10% NAV fall ($M)
Share of Mgmt & Advisory Fees
Evergreen NAV ($B)
Source: FY2026 Annual Report (Form 10-K), market-risk disclosure [11] and results of operations [12]; percentage derived.
The number is a single-variable estimate, so it understates a real downturn — redemptions, a carried-interest drought, and high-water-mark resets would arrive together (below). But it bounds the direct exposure of the recurring line, and the bound is small.
The 2022 stress test the numbers already ran
The last drawdown provides the clearest evidence. Fiscal 2023 (the year ended March 31, 2023) spans the 2022 bear market, when public equities fell about 20% and private valuations followed with a lag. Management and advisory fees did not fall; they rose 18% to $371.9 million, with evergreen revenue itself up $19.4 million [13]. The committed-capital base kept compounding through the shock.
Source: FY2023 Annual Report [14] and FY2026 Annual Report [15] results of operations.
Where the 2022 drawdown did land was on the market-sensitive lines that sit outside the recurring fee engine. Equity in income of investees — Hamilton Lane's own general-partner stakes, marked to fund NAVs — collapsed from $79.3 million in FY2022 to $6.5 million in FY2023, a 92% fall, and balance-sheet investments swung from a $59.6 million gain to a $10.3 million loss [16]. The cycle was plainly visible in the results — just not in the fees. That is the shape a value investor should expect to repeat: a resilient annuity, with the volatility routed into the mark-sensitive and performance-linked lines.
Where the cycle does bite — the top layer
The resilience of the base does not make the whole earnings stream cycle-proof, and the exposed part is precisely the part the bull case leans on. Three pressure points concentrate the risk.
Performance revenue under high-water marks. Fee-related performance revenue (FRPR) — incentive fees from evergreen funds that management counts as "recurring" because they are "not dependent on realization events" — grew from $2.4 million in FY2024 to $59.6 million in FY2025 to $102.5 million in FY2026, and now sits inside Fee Related Earnings of $344.5 million, close to 30% of it [17]. But FRPR is charged on evergreen NAV subject to high-water marks, and the company is explicit that "declines in NAV may delay or reduce future incentive fees by increasing the amount of subsequent NAV appreciation required to exceed the applicable high-water mark" [18]. Unlike a management fee, FRPR does not merely dip with a drawdown — it can fall to zero and stay there until NAV re-clears its prior peak, so its damage lingers across years rather than one reporting period.
Source: FY2026 Annual Report (Form 10-K), Fee Related Earnings reconciliation; FRE-ex-FRPR derived as FRE less FRPR [19].
Redemptions and gates. Evergreen funds offer periodic subscriptions and redemptions, each "subject to advance notice requirements, minimum holding periods, applicable gates, fund discretion and available liquidity" [20]. In a declining market the company warns that "the pace of redemptions or repurchases and consequent reduction in our assets under management could accelerate," and that meeting requests can force the sale of illiquid assets, whereby "the reduction in such fund's NAV resulting from the redemption or repurchase would reduce the management fees payable to us and may reduce or eliminate any incentive fees or carried interest" [21]. Gates protect the remaining fee base from a run, but the firm may "redeem or repurchase fewer interests than requested or suspend redemptions or repurchases entirely" — a defense that carries its own reputational and future-fundraising cost [22].
Carried interest and the exit cycle. The lumpy incentive line — $170.6 million of GAAP incentive fees in FY2026 — depends on realizations, which stall when exits and secondaries slow [23]. This was always understood to be cyclical; it is not where the "recurring" claim is tested.
A calibrated read
The evidence points one way on the core question and the other way on the growth. The recurring management-fee annuity is genuinely structural: about four-fifths of fee-earning AUM is charged on capital that does not move with markets, the company's own sensitivity math caps a 10% NAV shock at roughly 4% of management fees, and the base grew 18% straight through the 2022 drawdown. On that measure, the market's "cycle past its peak" fear is mislocated — it does not threaten the annuity.
The counter-fact sits in the same numbers. The market-sensitive slice — evergreen NAV fees, FRPR, carried interest — is exactly the layer that drove the recent acceleration: evergreen supplied roughly three-quarters of FY2026 fee-earning AUM growth (Growth Engine) and FRPR supplied most of the two-year Fee Related Earnings increase (Financials and Estimates). So a drawdown would leave the base intact while flattening the growth rate and denting the earnings-quality optics the bull case relies on — and FRPR's high-water marks mean that dent could persist for several years, not one.
Two things would sharpen this read, and neither is fully answerable from the corpus. First, the 2022 test predates the evergreen scale-up: the NAV-based book was a fraction of today's $14.3 billion then, so the cleanest proof of resilience covers a much smaller exposure than the one that now matters. Second, no drawdown since has yet forced the gates to be used at scale — the redemption machinery is documented but untested at current size. A genuine down-cycle in exits and secondaries, and the evergreen net-subscription and NAV prints through it, would settle whether the top layer resets modestly or severely. Until then, the durable read is that the annuity holds and the growth premium is what is at risk.
Own Capital
Hamilton Lane is not only a fee collector: it commits roughly 1% of its own capital to substantially all of its funds, alongside its clients [1]. That principal book reached $774.4M in FY2026 — about 85% of stockholders' equity — and it is tilting hardest toward evergreen, the same product driving both growth and cyclical risk [2]. Because these gains sit outside Fee-Related Earnings, the book is also the main engine of the company's GAAP earnings volatility.
A principal, not just a manager
Most of the report has treated Hamilton Lane as an asset-light fee machine. The balance sheet says something is also true alongside that: it is a private-markets investor with real money at risk. At March 31, 2026 the company carried $774.4M of its own investments — larger than its $361.0M of cash, and roughly 85% of its $915.2M of Hamilton Lane Incorporated stockholders' equity [3]. This is the company's own account; it sits apart from the $526.1M of "investments of Consolidated Funds and Partnerships," which belong mostly to outside fund investors and are offset by non-controlling interests [4].
Own Investment Book (FY26)
Share of Equity
Evergreen Sleeve Growth YoY
Unfunded GP Commitment
Sources: FY2026 Annual Report, Consolidated Balance Sheets [5]; Note 4. Investments [6]; Commitments and Contingencies [7].
The book has two parts. The larger is $567.9M of equity-method stakes in Hamilton Lane's own funds and separate accounts, where the general partner "has agreed to invest funds on the same basis as the limited partners" — a genuine pari-passu commitment, generally 1% of each fund [8][9]. The smaller is $206.6M of "measurement alternative" investments — strategic minority stakes in private companies held at cost less impairment, adjusted only for observable price changes [10]. Beyond the $567.9M already invested in its funds, the company is contractually bound to fund a further $272.2M of unfunded commitments when called [11]. Taken together, this is a much larger principal position than the fee-machine framing implies — and it is the mechanism behind the capital-alignment leg of the Ownership and Pay story, distinct from the voting control set out there.
Tilting toward evergreen
Where that own capital goes has shifted decisively. Broken out by strategy, the largest single sleeve of the GP book is now evergreen, at $194.1M — up 58% in one year and, for the first time, ahead of customized separate accounts [12].
Source: FY2026 Annual Report, Note 4. Investments [13].
This is the same evergreen engine analysed in Growth Engine and stress-tested in Drawdown Resilience, now seen from the company's own capital account. Management is not simply selling the semi-liquid evergreen product to clients; it is putting a growing share of its own balance sheet into it. That cuts two ways. It is a strong signal of belief — sponsors rarely concentrate their own money into a product they expect to disappoint. It is also concentration into the one part of the fee base that is marked to NAV every period, so the alignment and the cyclical exposure now travel together on Hamilton Lane's own books, not just its clients'.
The company is funding this from cash flow rather than coasting on distributions. Contributions to its own funds have accelerated — $57.7M in FY2024, $58.4M in FY2025, then $96.7M in FY2026 — comfortably above the roughly $47M of distributions and proceeds it received back from those funds in FY2026 [14]. For now the book is a net user of cash, funded alongside a rising dividend and an active buyback rather than instead of them.
Where the GAAP volatility comes from
The return on this book flows through a single income-statement line — equity in income of investees — and it is the most volatile number in the accounts. It has swung from $32.4M (FY2021) to $78.8M (FY2022), collapsed to $5.1M in the FY2023 drawdown, then recovered to $34.9M, $29.0M and $51.9M through FY2026 [15][16]. Within the FY2026 figure, evergreen was again the single largest contributor at $20.7M [17].
Source: FY2023 and FY2026 Annual Reports, Consolidated Statements of Income [18][19].
This line is deliberately excluded from Fee-Related Earnings, the recurring-profit measure management leads with [20]. That exclusion is what lets FRE and non-GAAP EPS look steady while GAAP earnings move around — and the FY2023 downturn shows how much the book carries. Even as the fee business strengthened that year (see Drawdown Resilience), GAAP diluted EPS fell from $3.98 to $3.01, because equity in income of investees dropped 94% and total other income fell from $144.1M to $2.6M [21]. The entire GAAP earnings decline in the last drawdown came from the balance-sheet investment book, not the fee engine.
The gap between Hamilton Lane's steady non-GAAP earnings and its wobblier GAAP results, noted in Financials and Estimates, has a specific source: the own-account investment book. Its gains are excluded from Fee-Related Earnings, so the volatility they inject is quarantined outside the metric the market anchors on.
The book's own-account sensitivity is not something the company puts a single number on — it describes "thousands of unique underlying portfolio investments" with no meaningful concentration, and quantifies only the $23.8M fee sensitivity to a 10% NAV move analysed in Drawdown Resilience [22]. The FY2023 experience is the better guide: in a genuine down-year, this line can shed most of its value, and it does so on a book that is now materially larger and more evergreen-weighted than it was then.
The alignment read
The evidence points one way on alignment. Hamilton Lane invests its own capital pari passu with clients across substantially all of its funds, is expanding that commitment out of operating cash flow, and is concentrating it into the strategy it is asking clients to back hardest [23][24]. Added to the insider voting control and price-hurdle compensation in Ownership and Pay, this is a second, capital-based layer of skin in the game — one that shows up as real dollars at risk rather than governance mechanics.
The strongest facts against reading it as an unqualified positive are on the same pages. This is market risk sitting on the balance sheet: it manufactured the entire GAAP earnings decline of the last drawdown, and the book is now larger and tilted toward the most cyclical, NAV-marked sleeve, so a future exit/secondaries down-cycle would hit both the growth story and reported earnings at once. The measurement-alternative corner is the least transparent: $206.6M of stakes that are not named, carrying $79.4M of cumulative unrealized gains against $43.3M of cumulative unrealized losses that have not moved for three years — a book whose marks update only on observable transactions, which can lag reality [25].
What would change the read is observable. If contributions keep outrunning distributions with few realizations, the book turns from an alignment asset into a persistent cash sink competing with the dividend and buyback; the $96.7M FY2026 contribution against roughly $47M returned is the first data point to watch [26]. And a repeat of FY2023 — this time on a $194.1M evergreen sleeve rather than the smaller book of three years ago — would hit reported earnings and the growth story together.
Where the debate actually sits
Across the prior chapters the disagreement over Hamilton Lane narrows to a short list of shared facts read two ways. The recurring management-fee annuity is resilient and proven through the last cycle; the debate is about the growth premium layered on top — evergreen flows, the 67-basis-point fee rate, and performance-linked revenue now sitting inside "recurring" earnings — plus a standing governance discount. This chapter reconciles both reads, frames an illustrative value range, and names what would move it.
The starting point both sides accept is the de-rating itself. From the November-2024 peak to mid-2026 the share price fell ~59% while non-GAAP EPS rose ~17%, compressing the multiple from ~40x to ~14x — but that low-teens multiple values a Fee-Related-Earnings base whose two-year growth was roughly 73% supplied by a performance-linked FRPR line ($2.4M to $102.5M), so the de-rating partly reprices earnings quality, not just sentiment [1] [2]. The full decomposition is the subject of Valuation; the question a synthesis has to answer is what the two sides do with the same numbers from here.
The bull and the bear do not actually disagree about the core. The management-fee engine is structurally insensitive to markets: about 82% of the $81.5B fee-earning AUM is charged on committed or net-invested capital that is not marked to market, and the company's own math caps the hit from a 10% NAV decline at roughly $23.8M — about 4% of management and advisory fees [3]. That resilience is not theoretical: through fiscal 2023, which spans the 2022 bear market, management and advisory fees rose 18% to $371.9M even as the firm's mark-sensitive lines collapsed [4]. The real argument is about the layer on top — the growth premium and the earnings quality behind it — and about how much a governance-passive minority should pay for it.
Those two debates are not independent. Roughly three-quarters of FY2026's fee-earning-AUM growth and about 73% of the two-year Fee-Related-Earnings increase both trace to the same ~$14.3B evergreen NAV layer — only ~18% of the fee base and charged on high-water-marked NAV — so Hamilton Lane's growth engine, its earnings-quality overhang, and its cyclical exposure are one and the same asset.
The stakes sit in the earnings-quality split. Of the $344.5M in fee-related earnings, roughly 30% is fee-related performance revenue — $102.5M, up from $2.4M two years earlier [5] — charged on high-water-marked evergreen NAV; stripped of that line, fee-related earnings grew far slower than the ~29% headline, and a drawdown can hold the performance-revenue contribution near zero for years until NAV re-clears its prior peak [6]. The counter is that the management-fee base compounded about 13.7% a year on its own and roughly 82% of the fee base is not marked to market, so the recurring core keeps growing even if the evergreen layer stalls [7] [8].
The tension, fact by fact
Sources: fee-related performance revenue and FRE, FY2026 10-K [9]; NAV sensitivity [10]; fee-earning AUM and blended rate [11], [12]; net cash and TRA [13]; voting versus economics [14]; StepStone fee-earning AUM [15]; GCM Grosvenor margin [16]; consensus per estimates feed.
Across the rows, the disagreement is narrower than the price action suggests. Rows 2 and 3 are the same fact seen from two ends: the layer that drove the recent acceleration — evergreen NAV and the high-water-marked performance revenue riding on it [17] — is precisely the layer that behaves worst in a drawdown [18]. That is why the resilience shown in Drawdown Resilience and the earnings-quality caveat from Financials and Estimates are both correct at once, and why neither settles the case alone.
On the balance of evidence, the recurring core looks durable and the disagreement that matters is about the growth premium and how much of the 67-basis-point fee rate survives a cooler cycle [19]. The strongest fact against that read is competitive: StepStone reached $144.0B of fee-earning AUM growing 19% while its blended fee rate fell to 63 basis points [20], so the fastest-growing peer in the same model is taking share at a lower, declining price — a plausible template for where HLNE's premium eventually lands. What would change the read is evidence in either direction on that fee rate and on evergreen net flows through a genuine down-cycle; both are checkable in the quarterly disclosure.
An illustrative value range
The scenarios below are illustrative arithmetic — EPS times a multiple — not price targets, and they are most sensitive to the multiple, which is in turn a proxy for how durable the market judges the evergreen-led growth to be. Spot is $83.16; the consensus mean target is $126.86, with a published range of $94 to $174.
Source: derived — illustrative multiples applied to FY2028 consensus EPS (estimates feed) and a below-consensus bear EPS; FRE and non-GAAP EPS basis per FY2026 10-K [21].
Source: derived from FY2028 consensus EPS and illustrative multiples; consensus per estimates feed.
The distribution is asymmetric, and the asymmetry rests on facts rather than optimism: the balance sheet is net cash — $360.9M against $278.4M of debt, with a $235.4M tax-receivable claim behind it [22]; the dividend is covered and has been raised annually; and management deployed the buyback at a weighted-average $100.43 per share, above today's price [23]. The bear case is therefore not solvency; it is a lower multiple on lower-quality growth. The counterweight the bull has to respect is a ceiling on that upside. Insiders steer 64% of the vote on 25% of the economics while public holders also fund a $235.4M tax-receivable-agreement payable that accelerates to a lump sum on any change of control, so the same block that governs Hamilton Lane also makes it effectively unsellable without insider consent. A control-premium floor under the bull scenario is therefore unlikely to be tested [24].
What to watch
Each item below is checkable in a specific filing line, with a threshold that would move the read one way or the other.
Sources: blended fee rate, Q4 FY2026 call [25]; management and advisory fees [26]; FRE and FRPR reconciliation [27]; buyback [28].
What the corpus cannot settle
Three questions stay open on the evidence available, and each maps directly onto a scenario driver. First, how evergreen net subscriptions and NAV behave in a real exit and secondaries down-cycle at today's roughly $14.3B scale: the 2022 resilience proof predates that build-out, so the current-size stress is untested in the record [29]. Second, the organic-versus-one-time split in the FY2027 consensus ramp — how much of the modeled +19% is run-rate fee-earning AUM growth versus the one-time Guardian portfolio onboarding and an incentive-fee recovery — is not disclosed at that granularity. Third, live peer valuation multiples for StepStone, GCM Grosvenor, Ares, Blackstone and Carlyle were not obtainable this run, so the claim that low-teens is a genuine discount rests on Hamilton Lane's own history rather than a current peer cross-section. The relative-value gap in Valuation remains, on this evidence, unclosed.